Reporting
OnWheel supports providing various standard reports based on the needs of different partners. Each type of report will provide different metrics and data to help customers monitor performance and discover important insights.
Efficient Use of Statistical Reports
Filtering Information
Customers need to enter specific information to accurately filter the results of the report:
- Time: Customers choose the Start Date and End Date to get the report results within the desired time range. The time format (Timeview) can be in days or months.
- Yesterday's Data:
- Y(y): If customers want to view data only from yesterday, they choose Y(y).
- N(n): If customers want to view all orders within the selected time range.

Downloading Reports
Each report will have a symbol at the top right corner of each detailed report. Customers can download reports to meet the needs of operational statistics.
Basic Reports
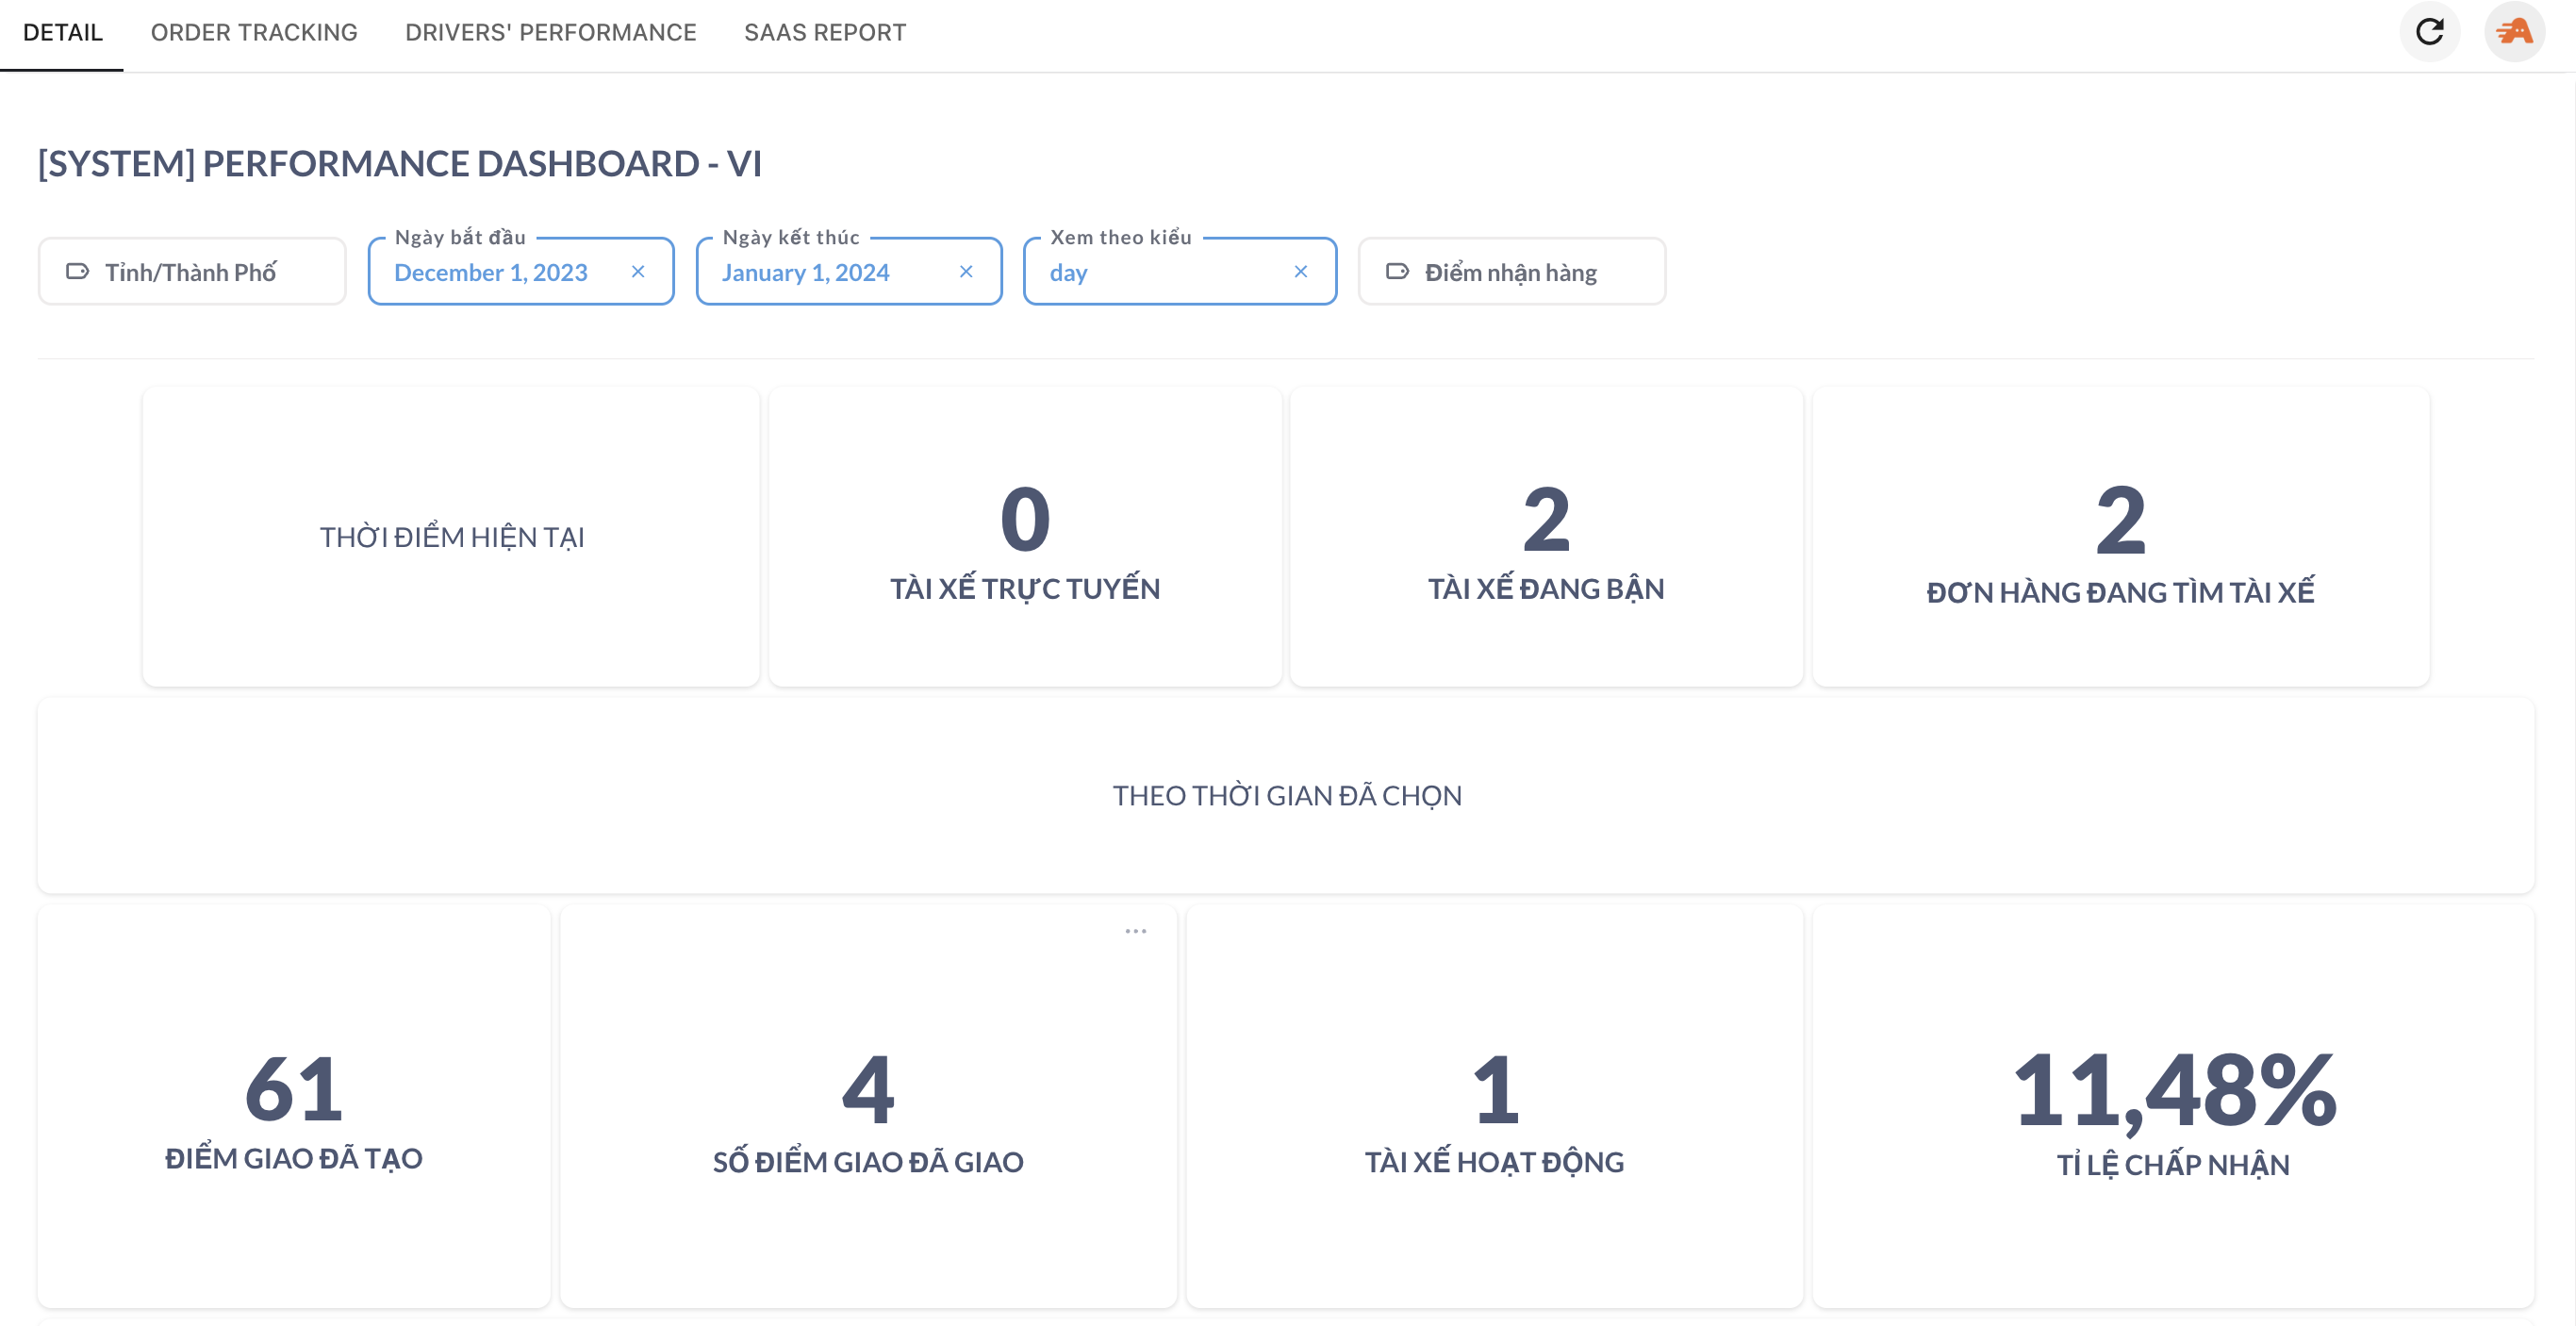
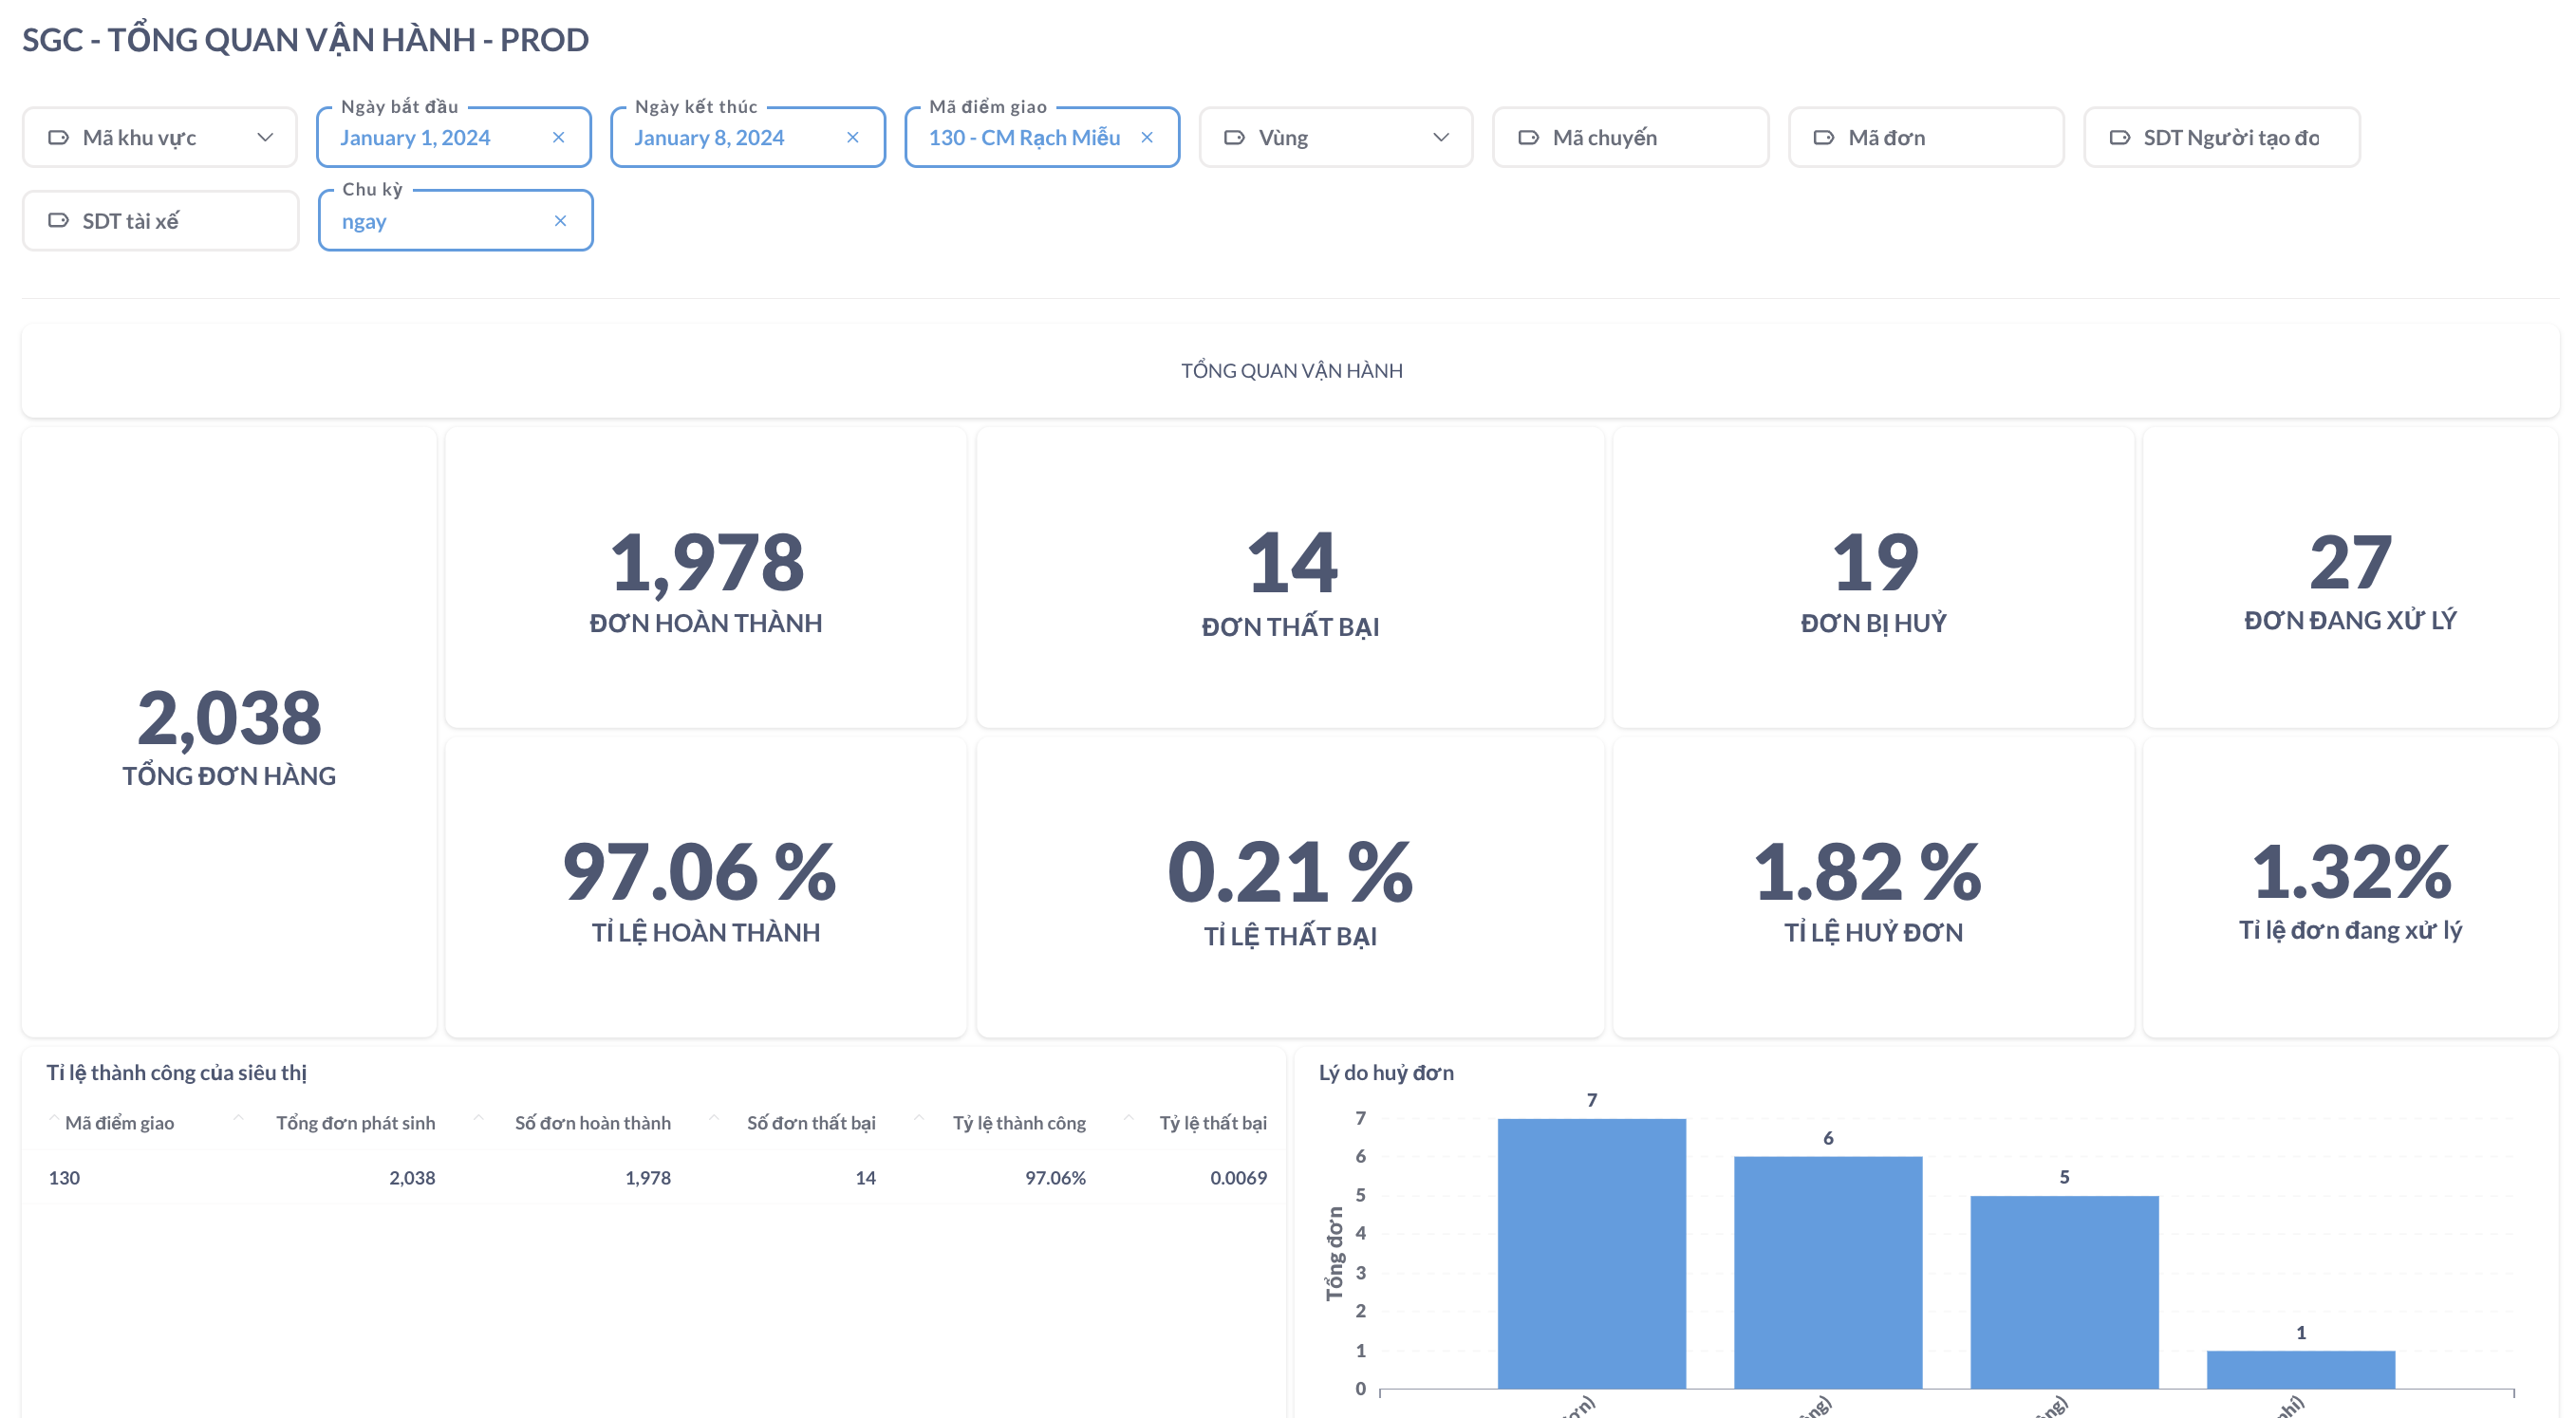
Operational Overview
This report provides basic information about operational metrics:
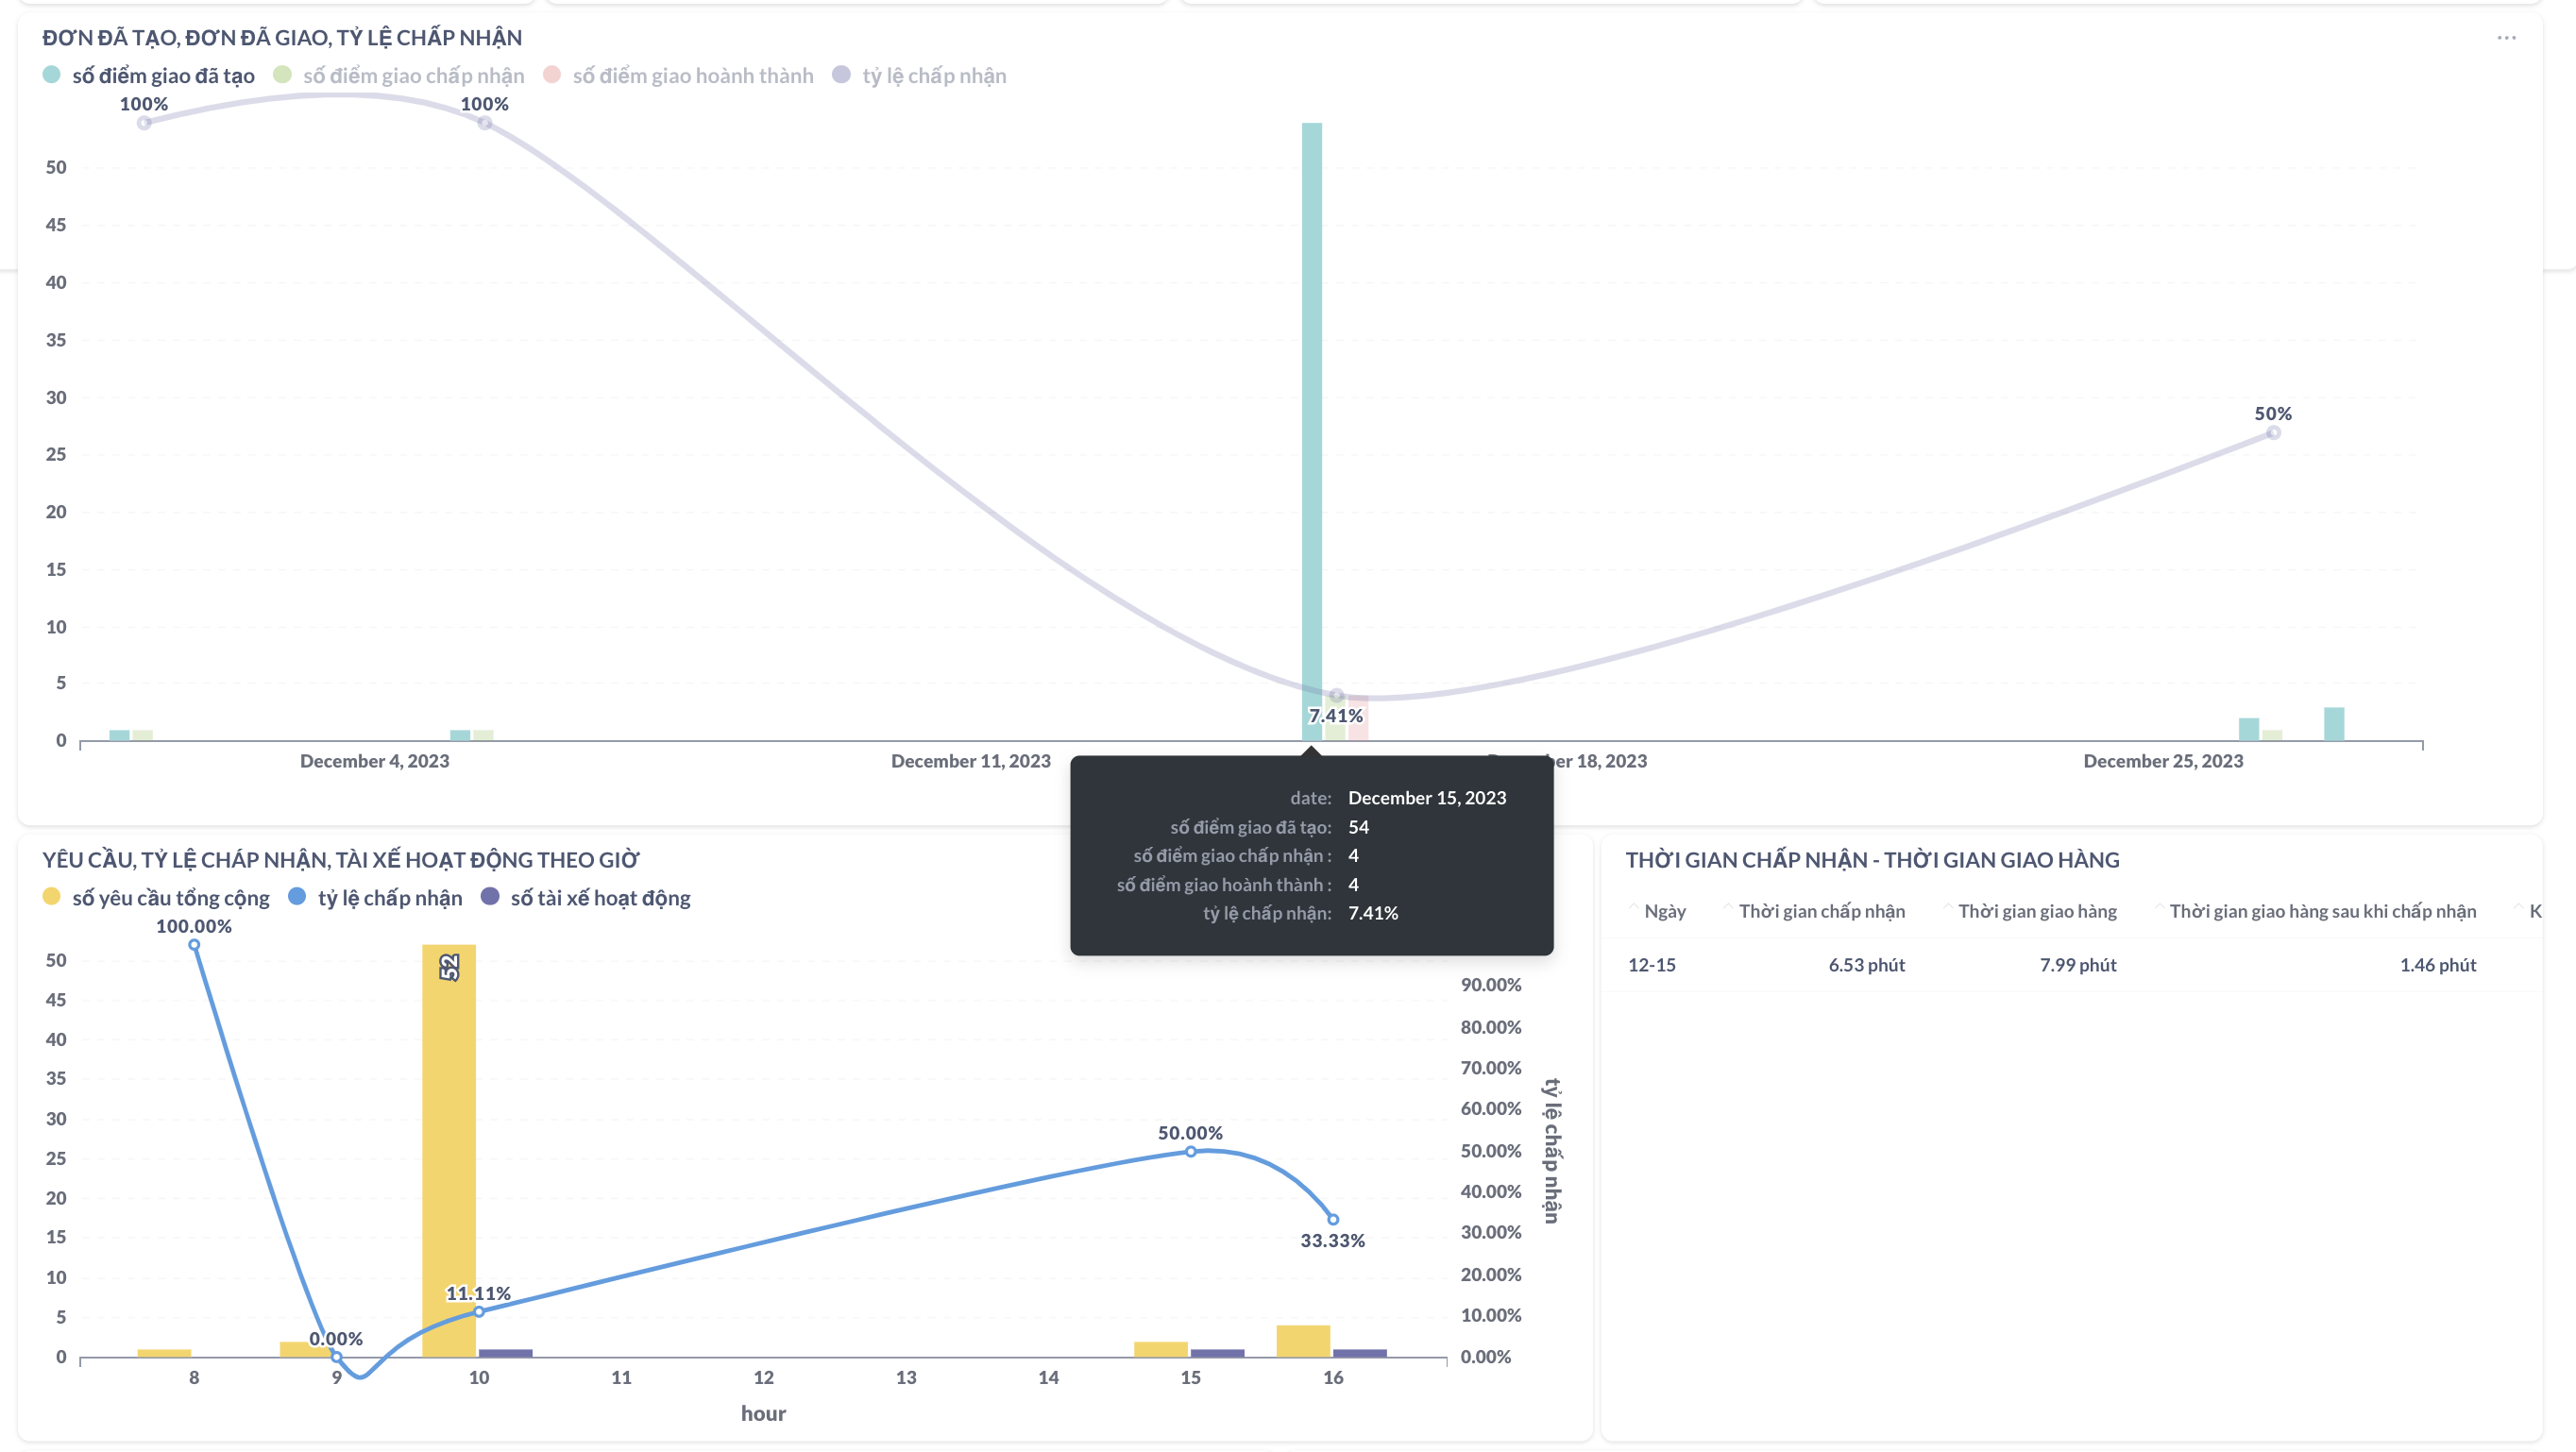
- Orders created, Orders delivered, Acceptance rate
- Requests, Acceptance rate, Driver activity by hour
- Acceptance time - Delivery time
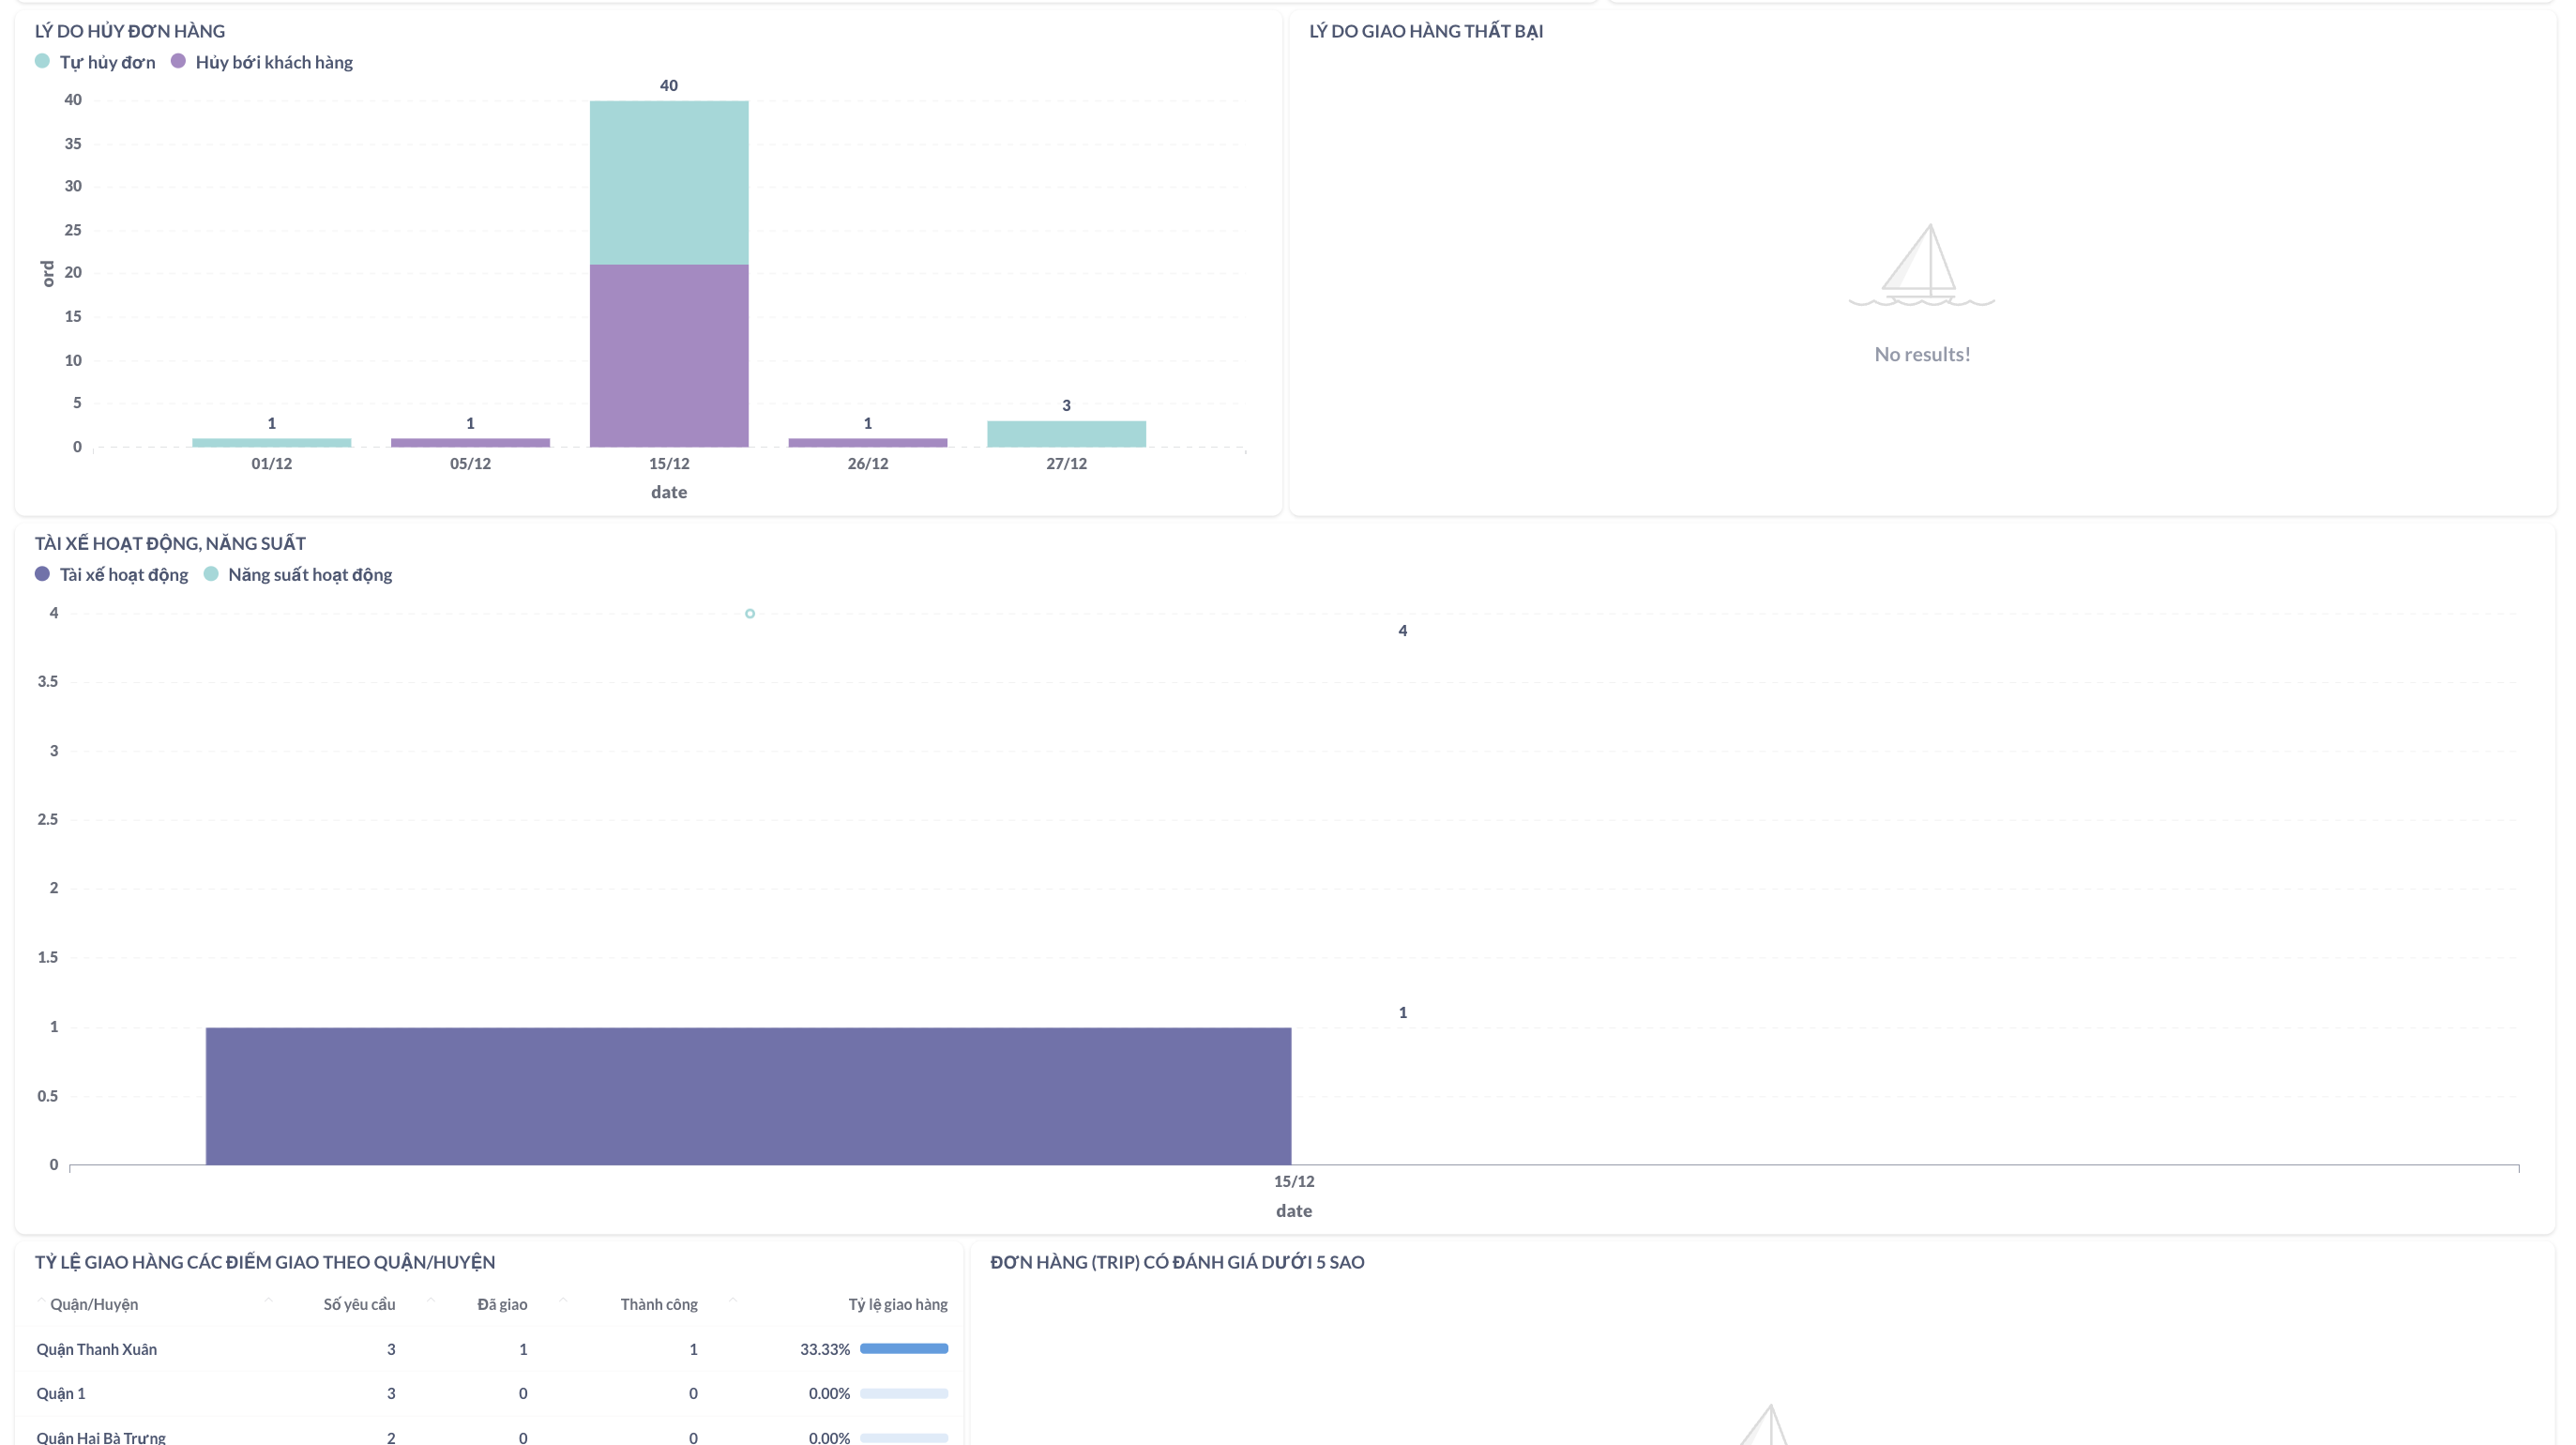
- Reasons for canceling orders
- Reasons for failed deliveries
- Driver activity, productivity
- Delivery rate to delivery points by District/Ward
- Orders (TRIP) with a rating below 5 stars
- Delivery rate by branch
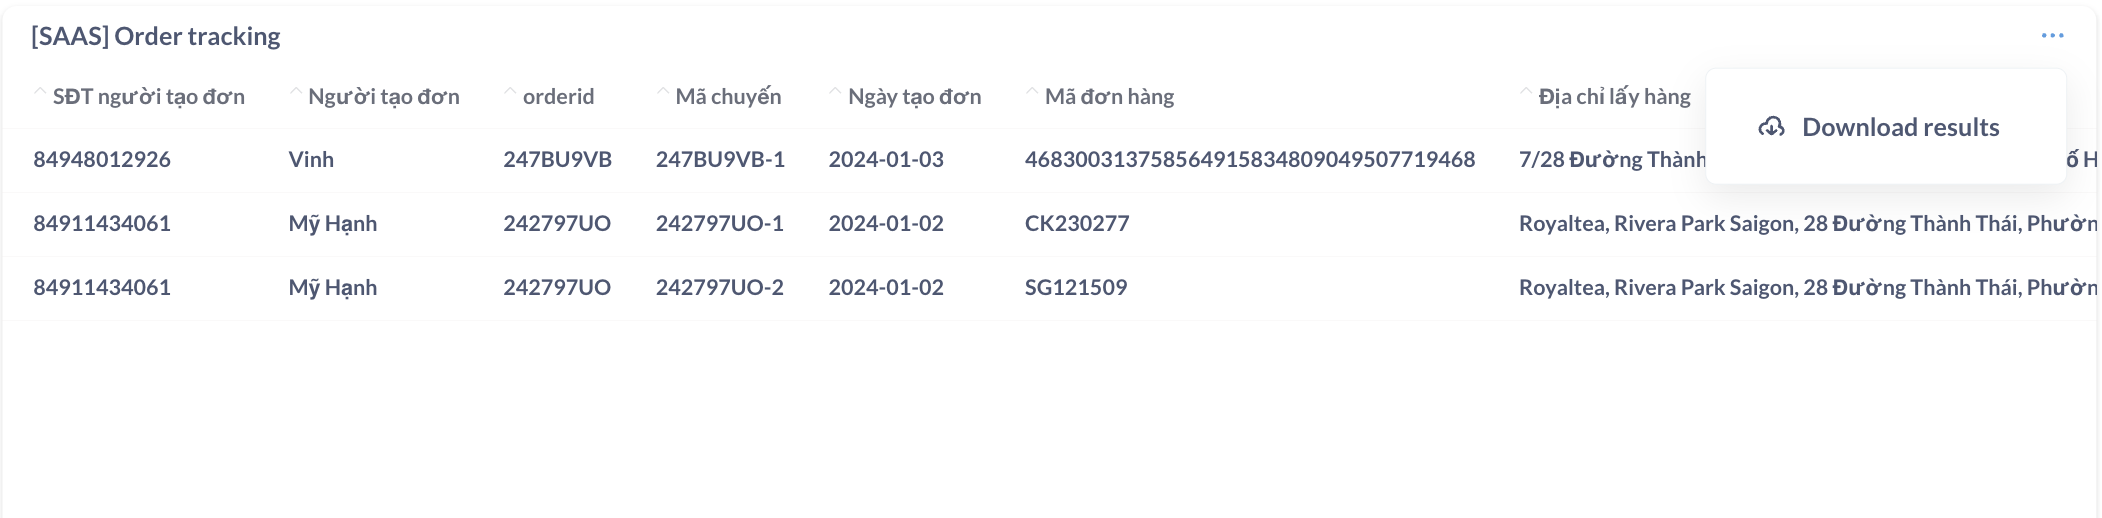
Order Details
This report provides all the details of each delivery point in an order:
- Status ratio of orders
- Order details
- Overall driver productivity
![]()
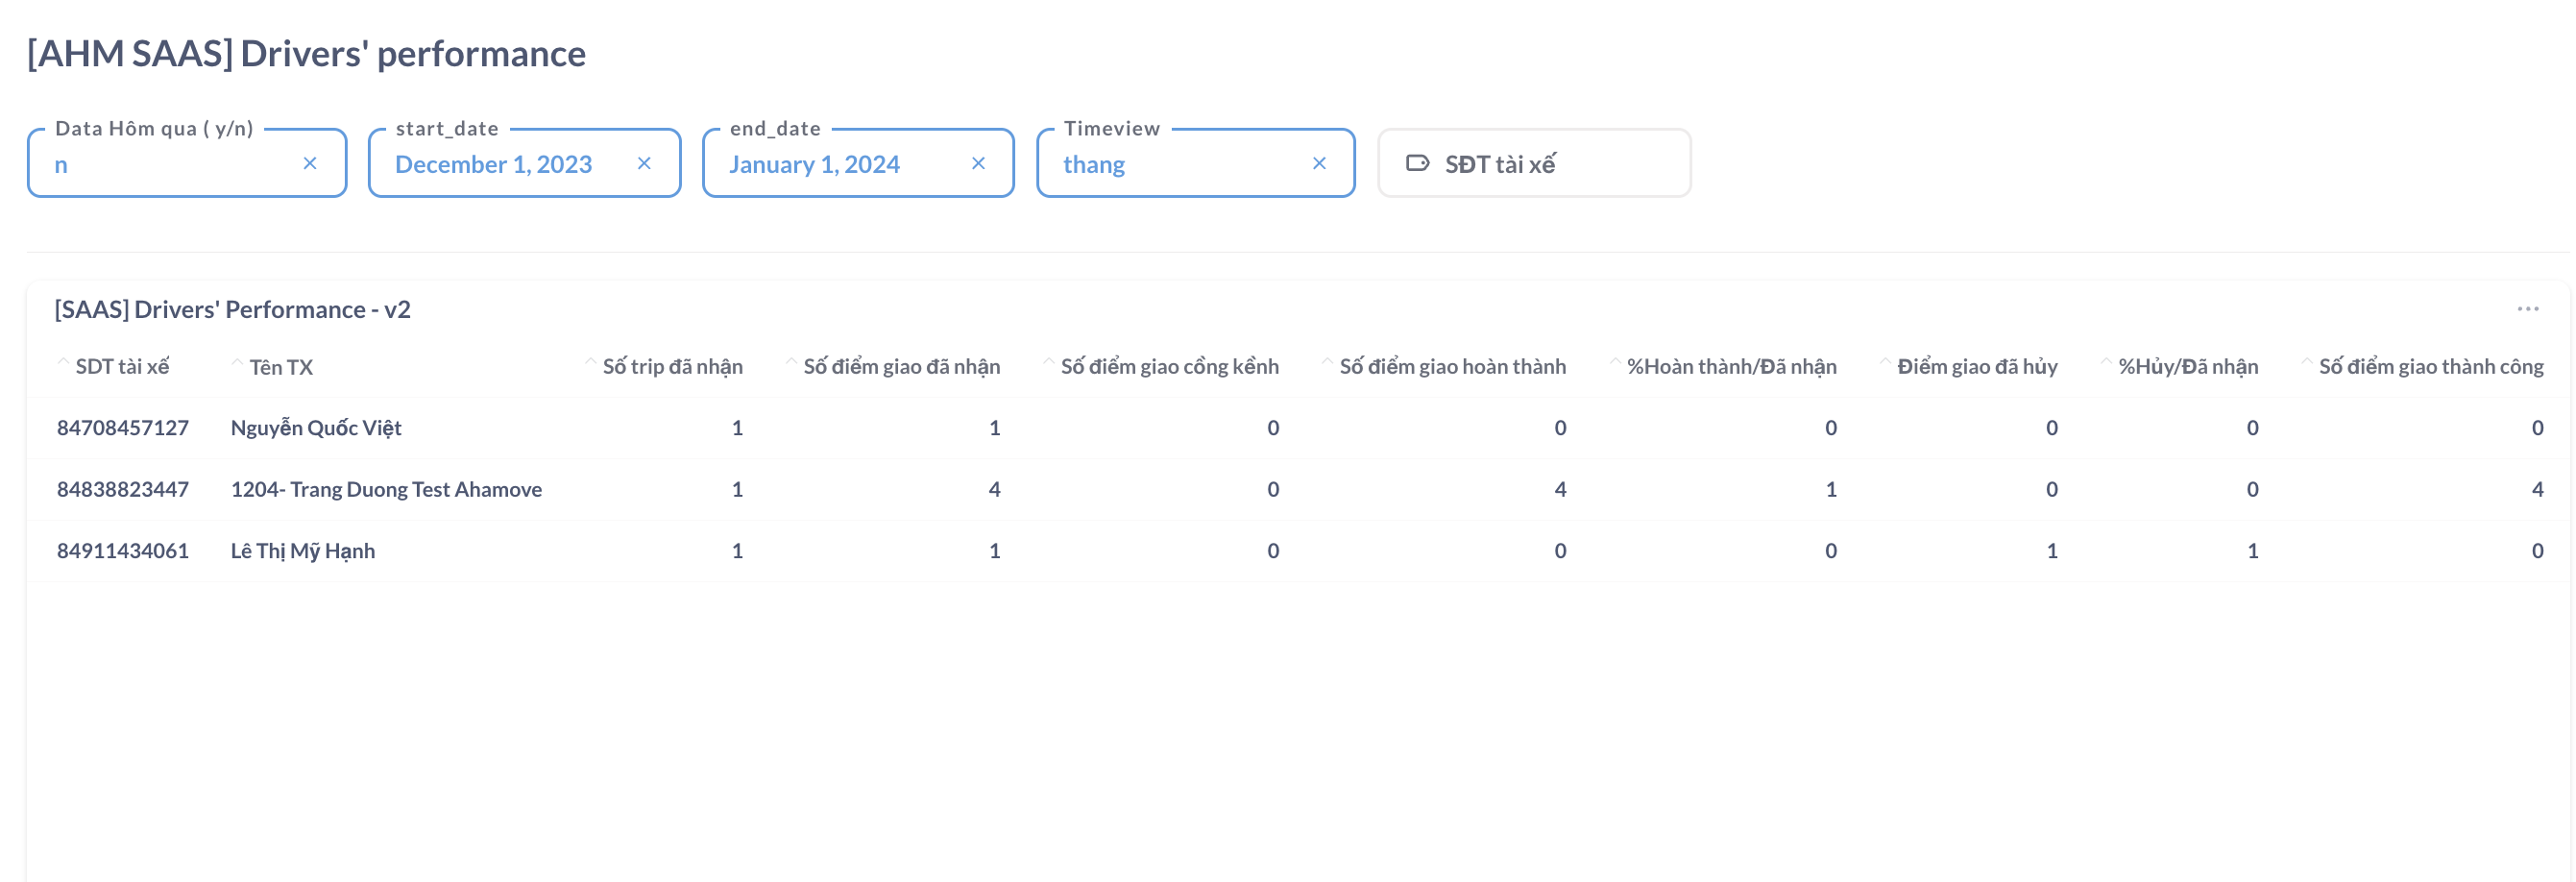
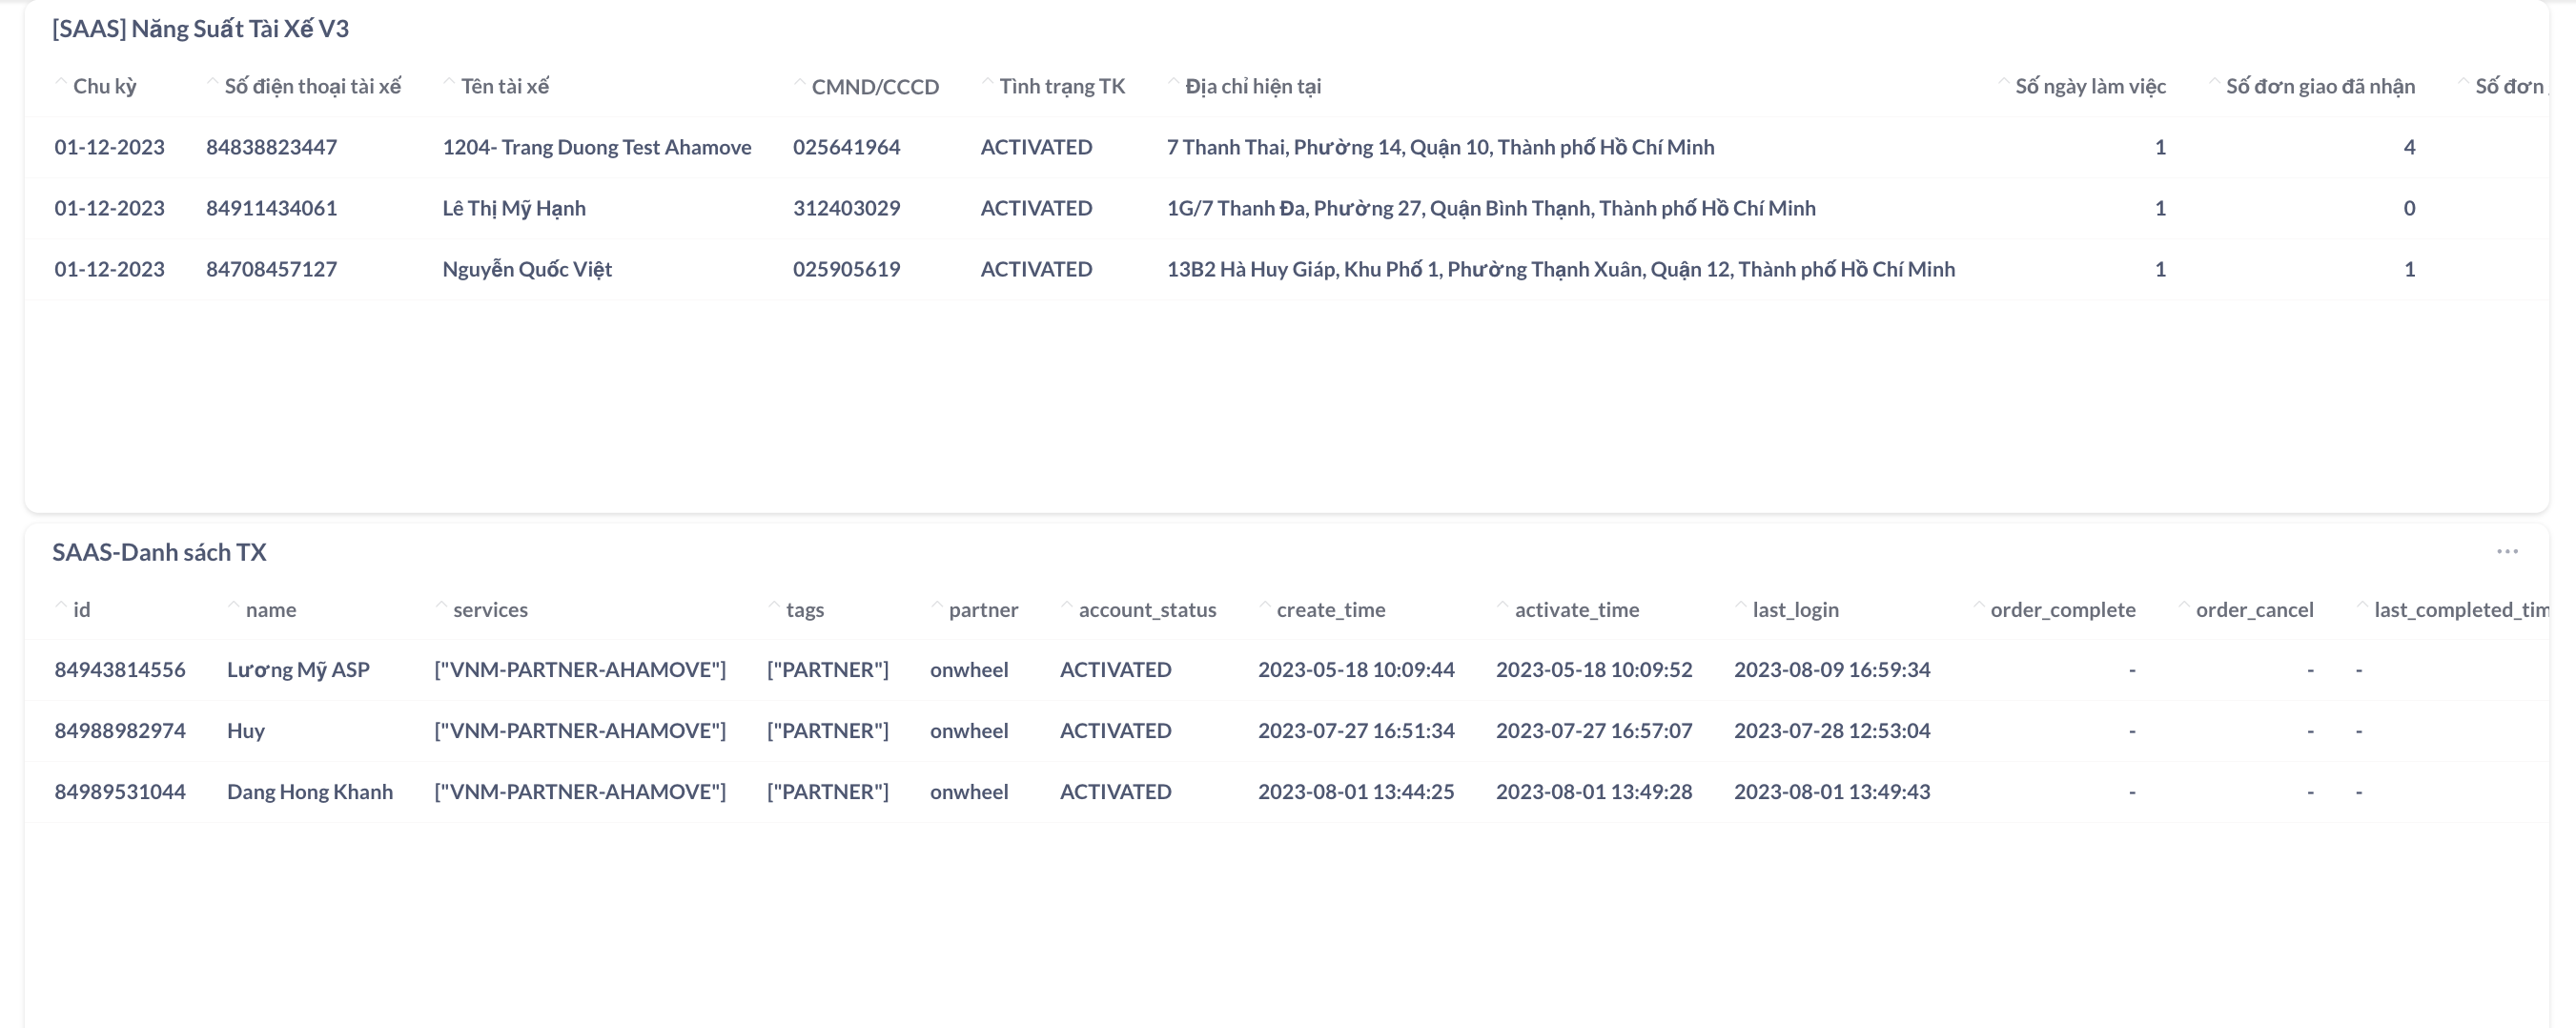
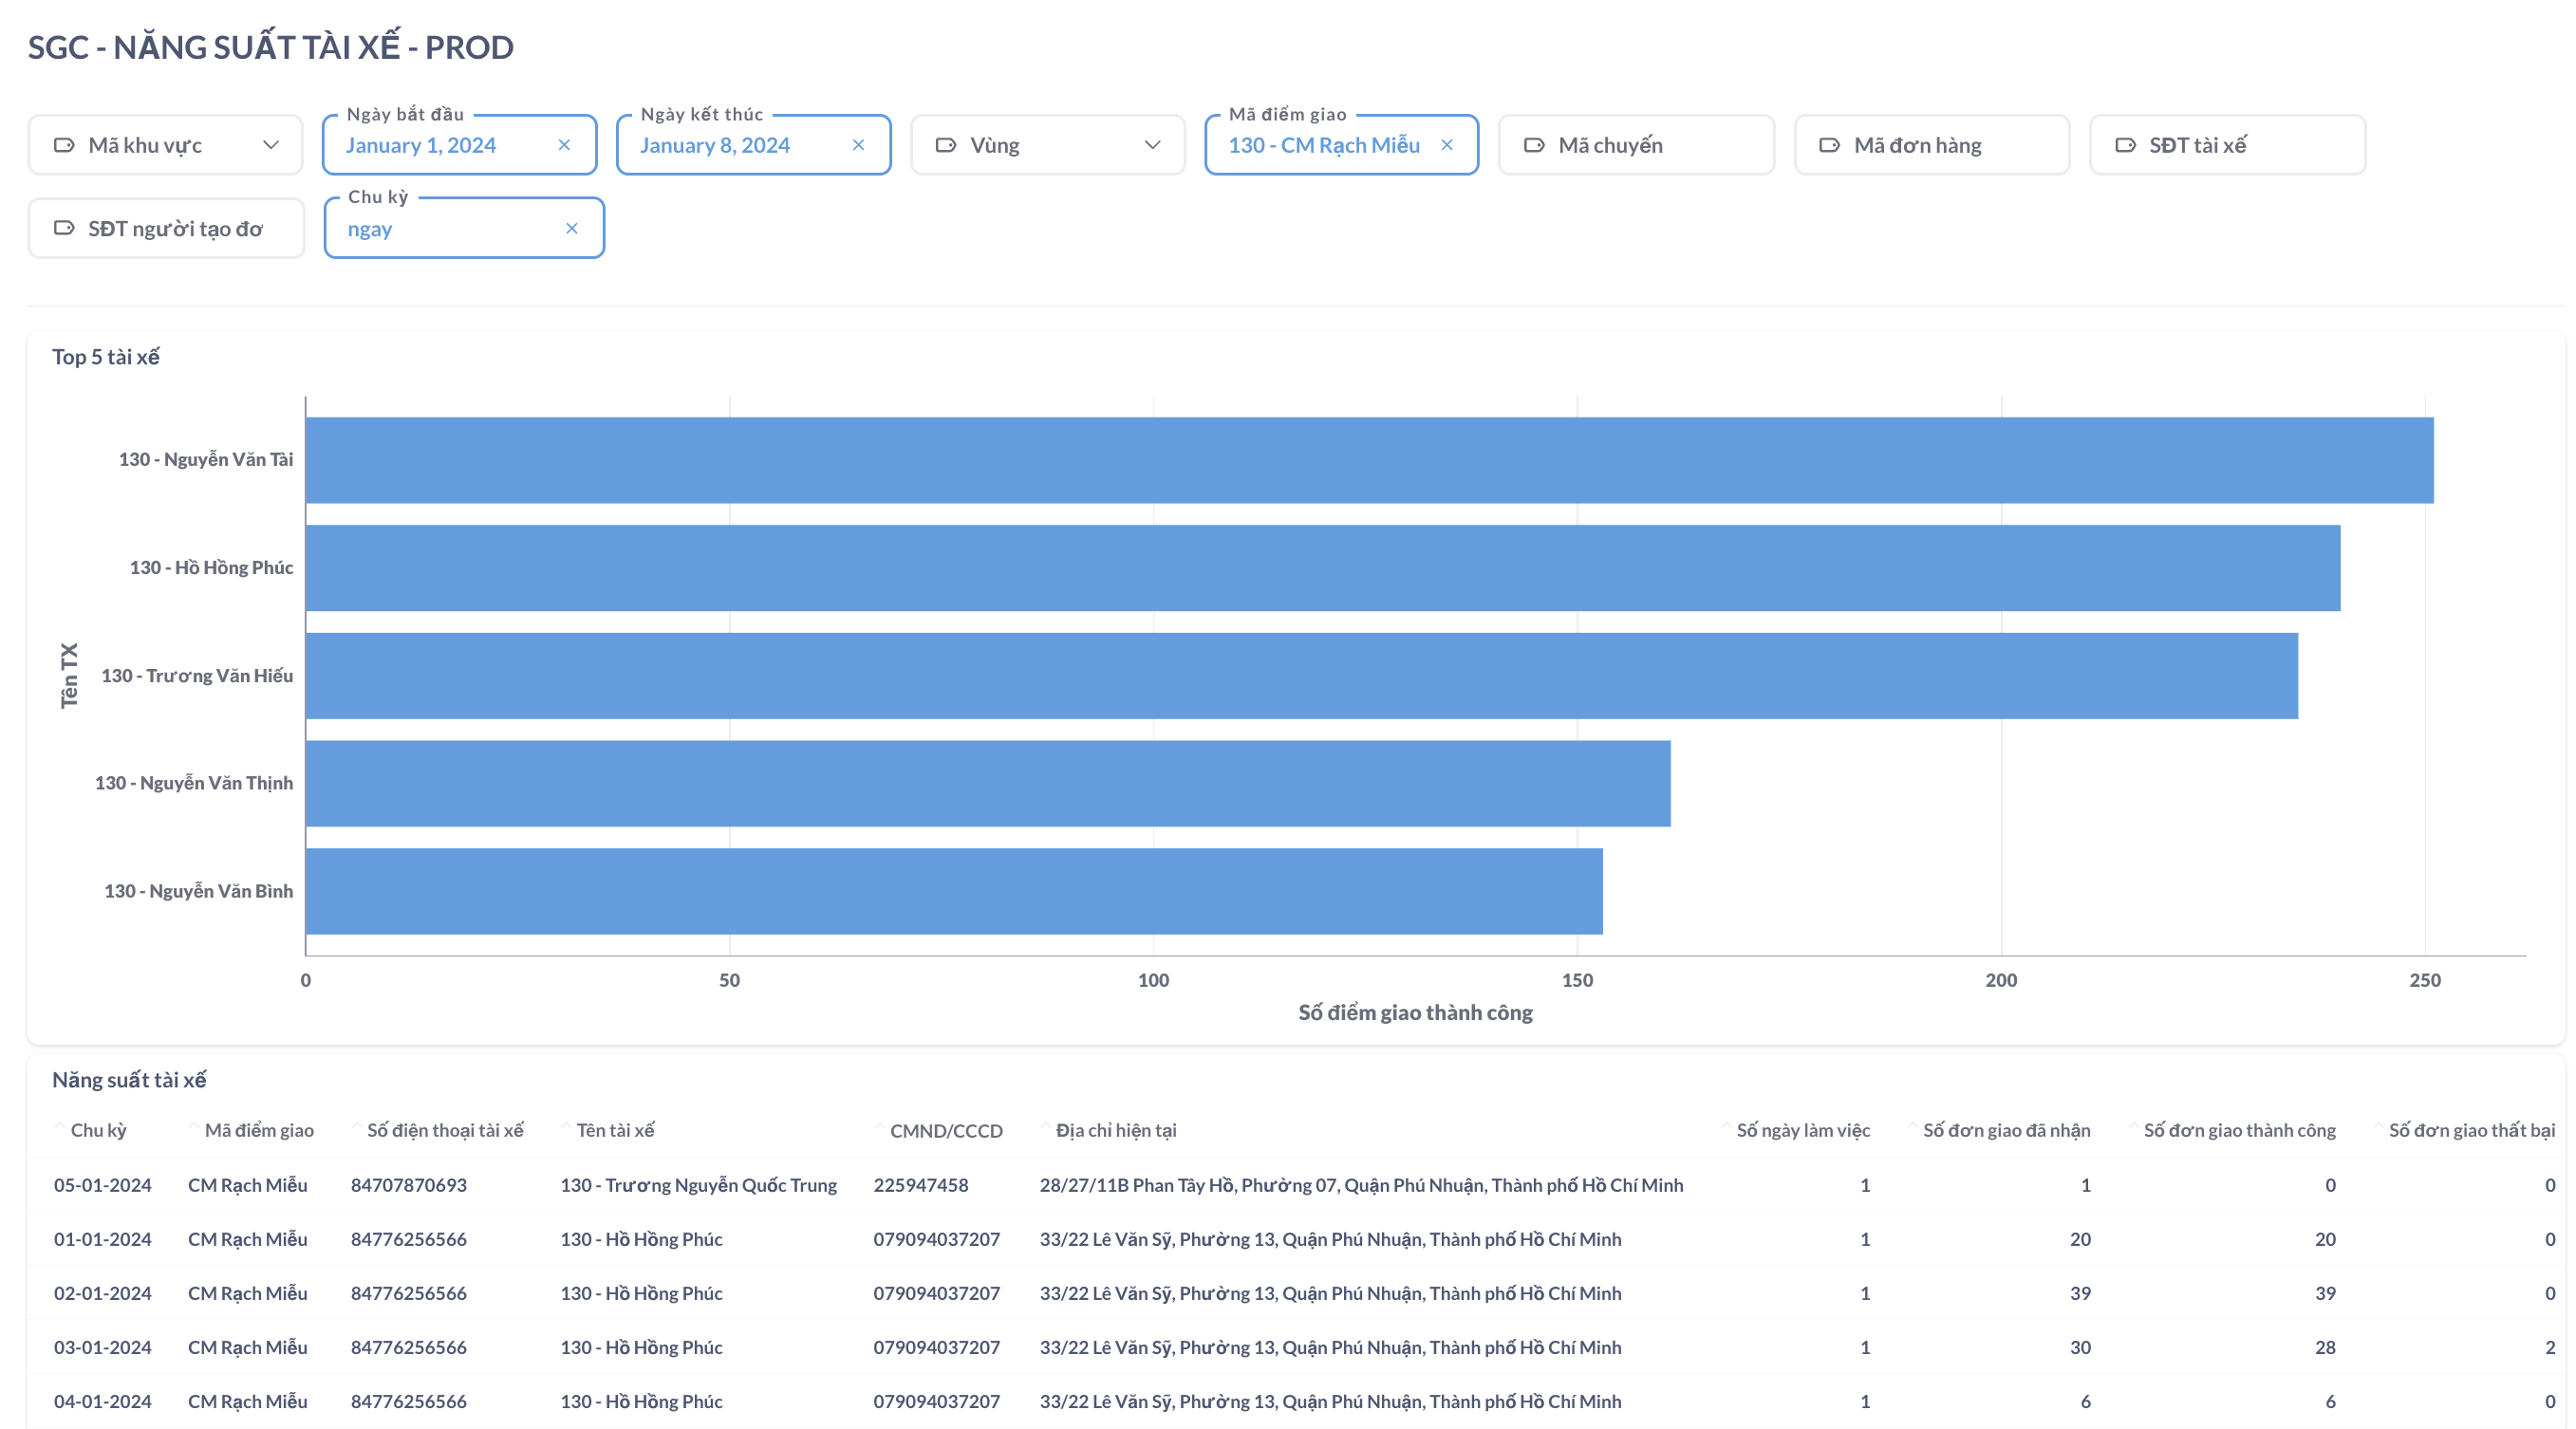
Driver Productivity
This report provides metrics to monitor and evaluate the productivity of internal drivers:
- Statistics of driver activity metrics
- Driver work productivity
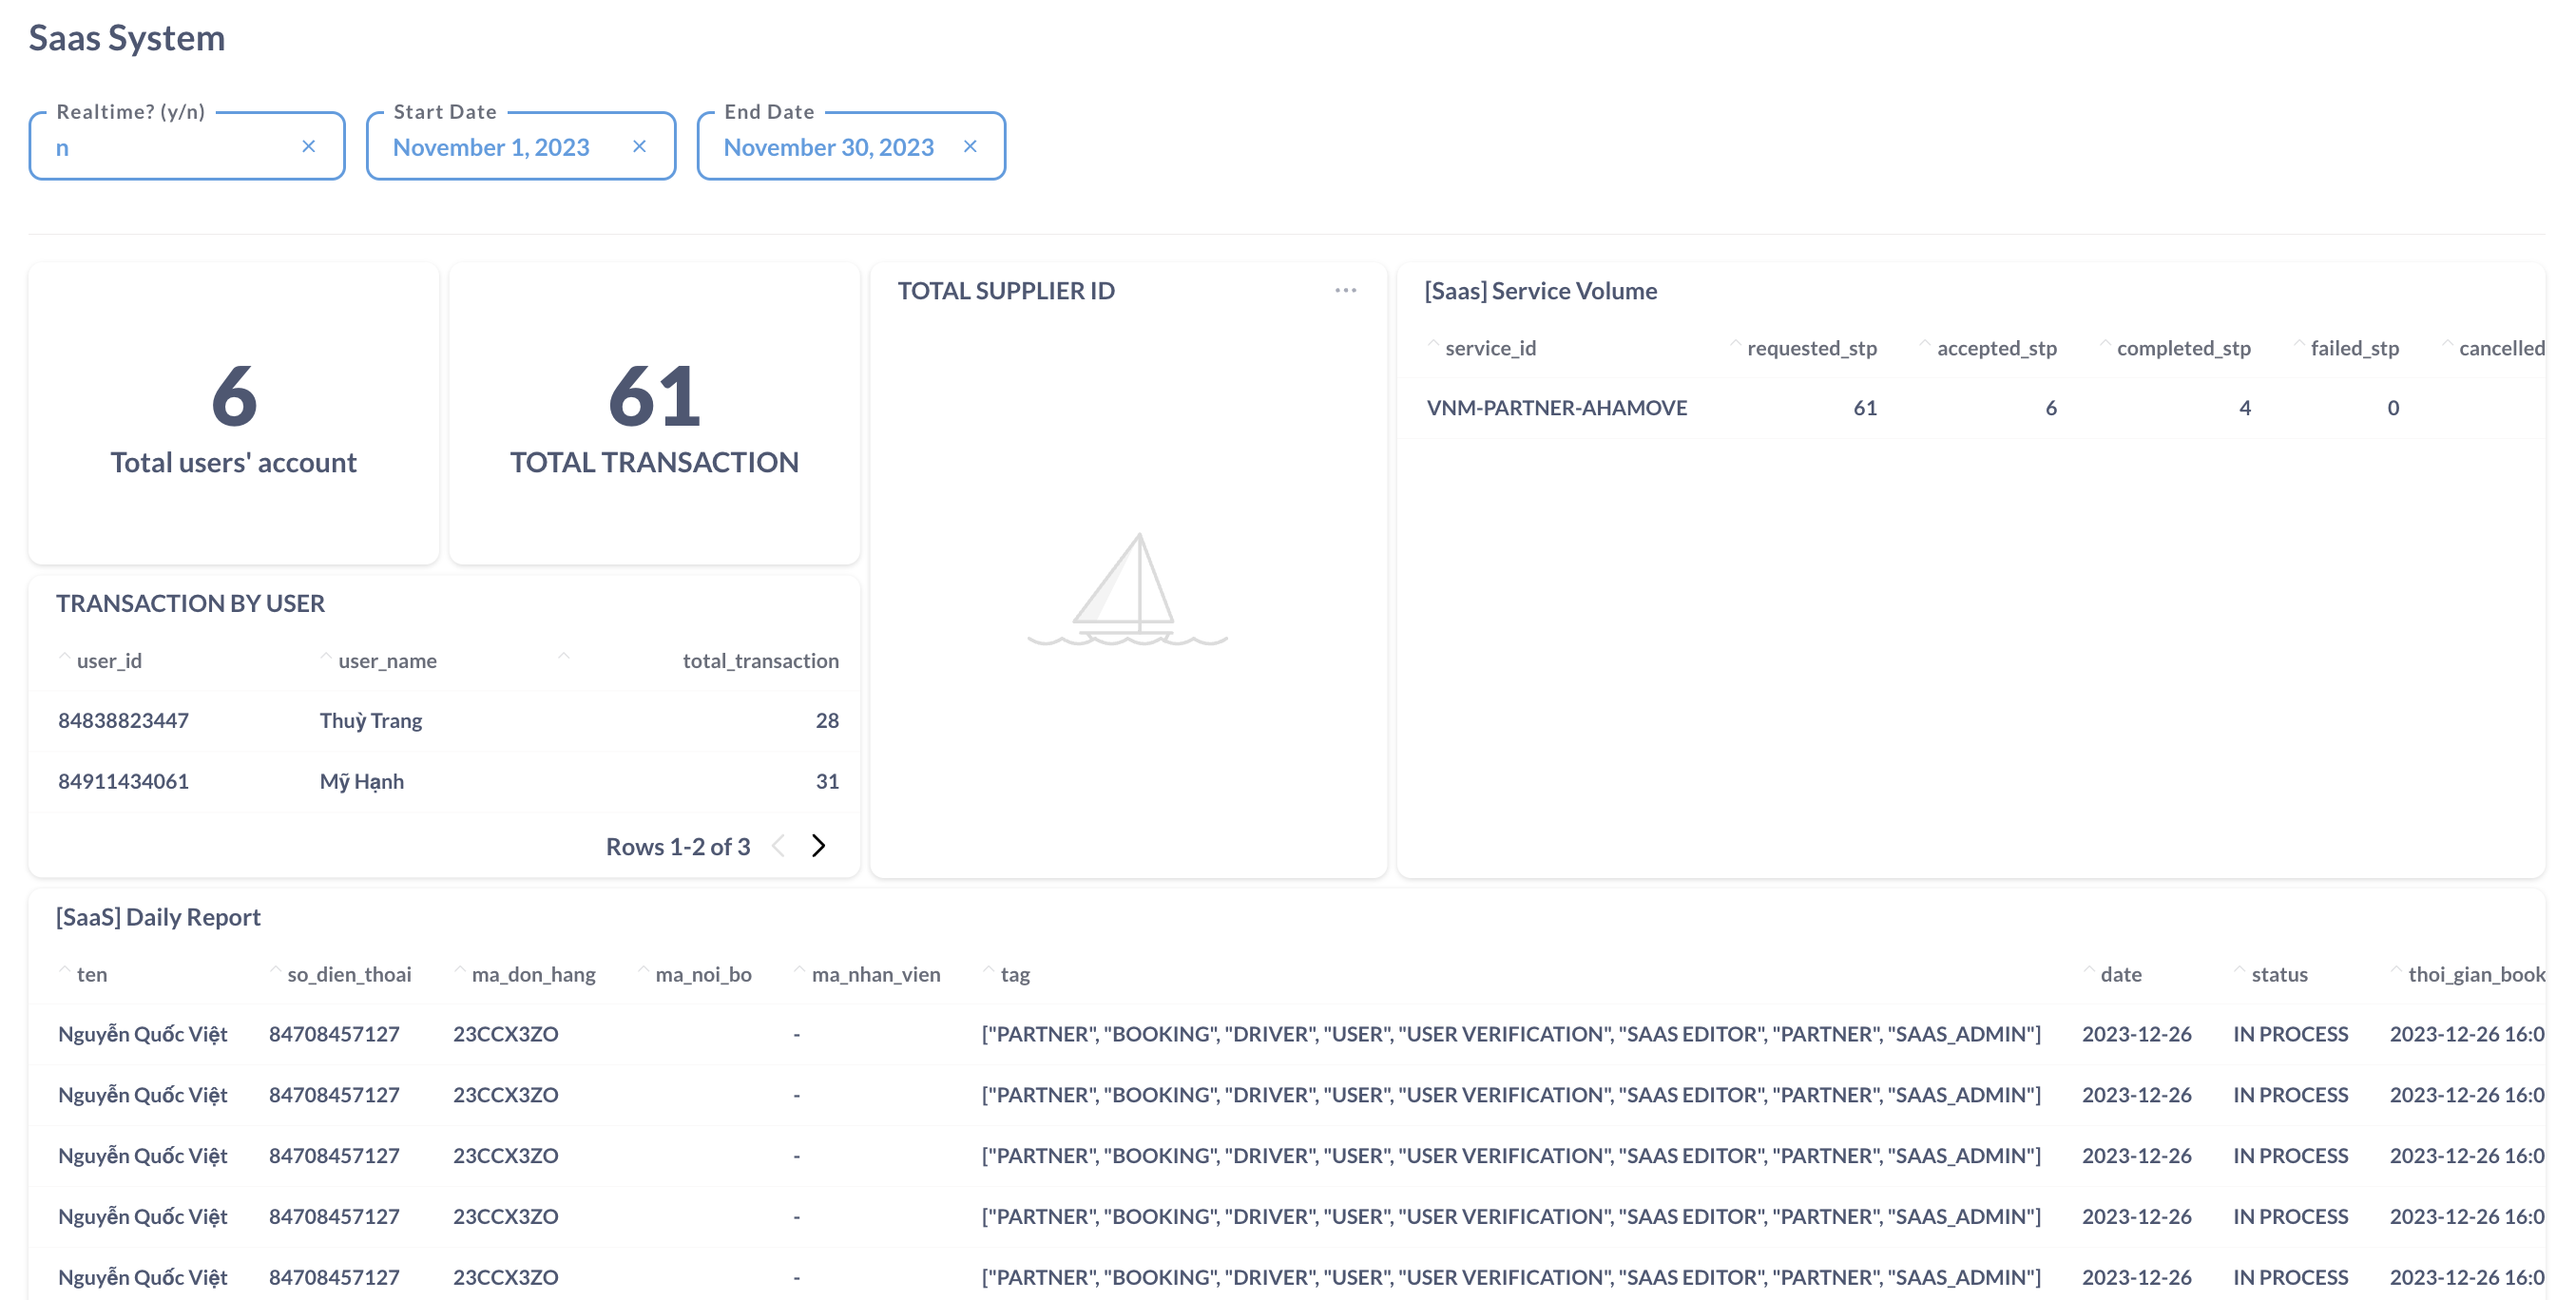
SAAS Report
Statistics report of internal Onwheel service metrics:
- Total User accounts
- Total number of internal drivers
- Total transactions
- Transactions for each User
- Overall operation of each internal service
- Daily report
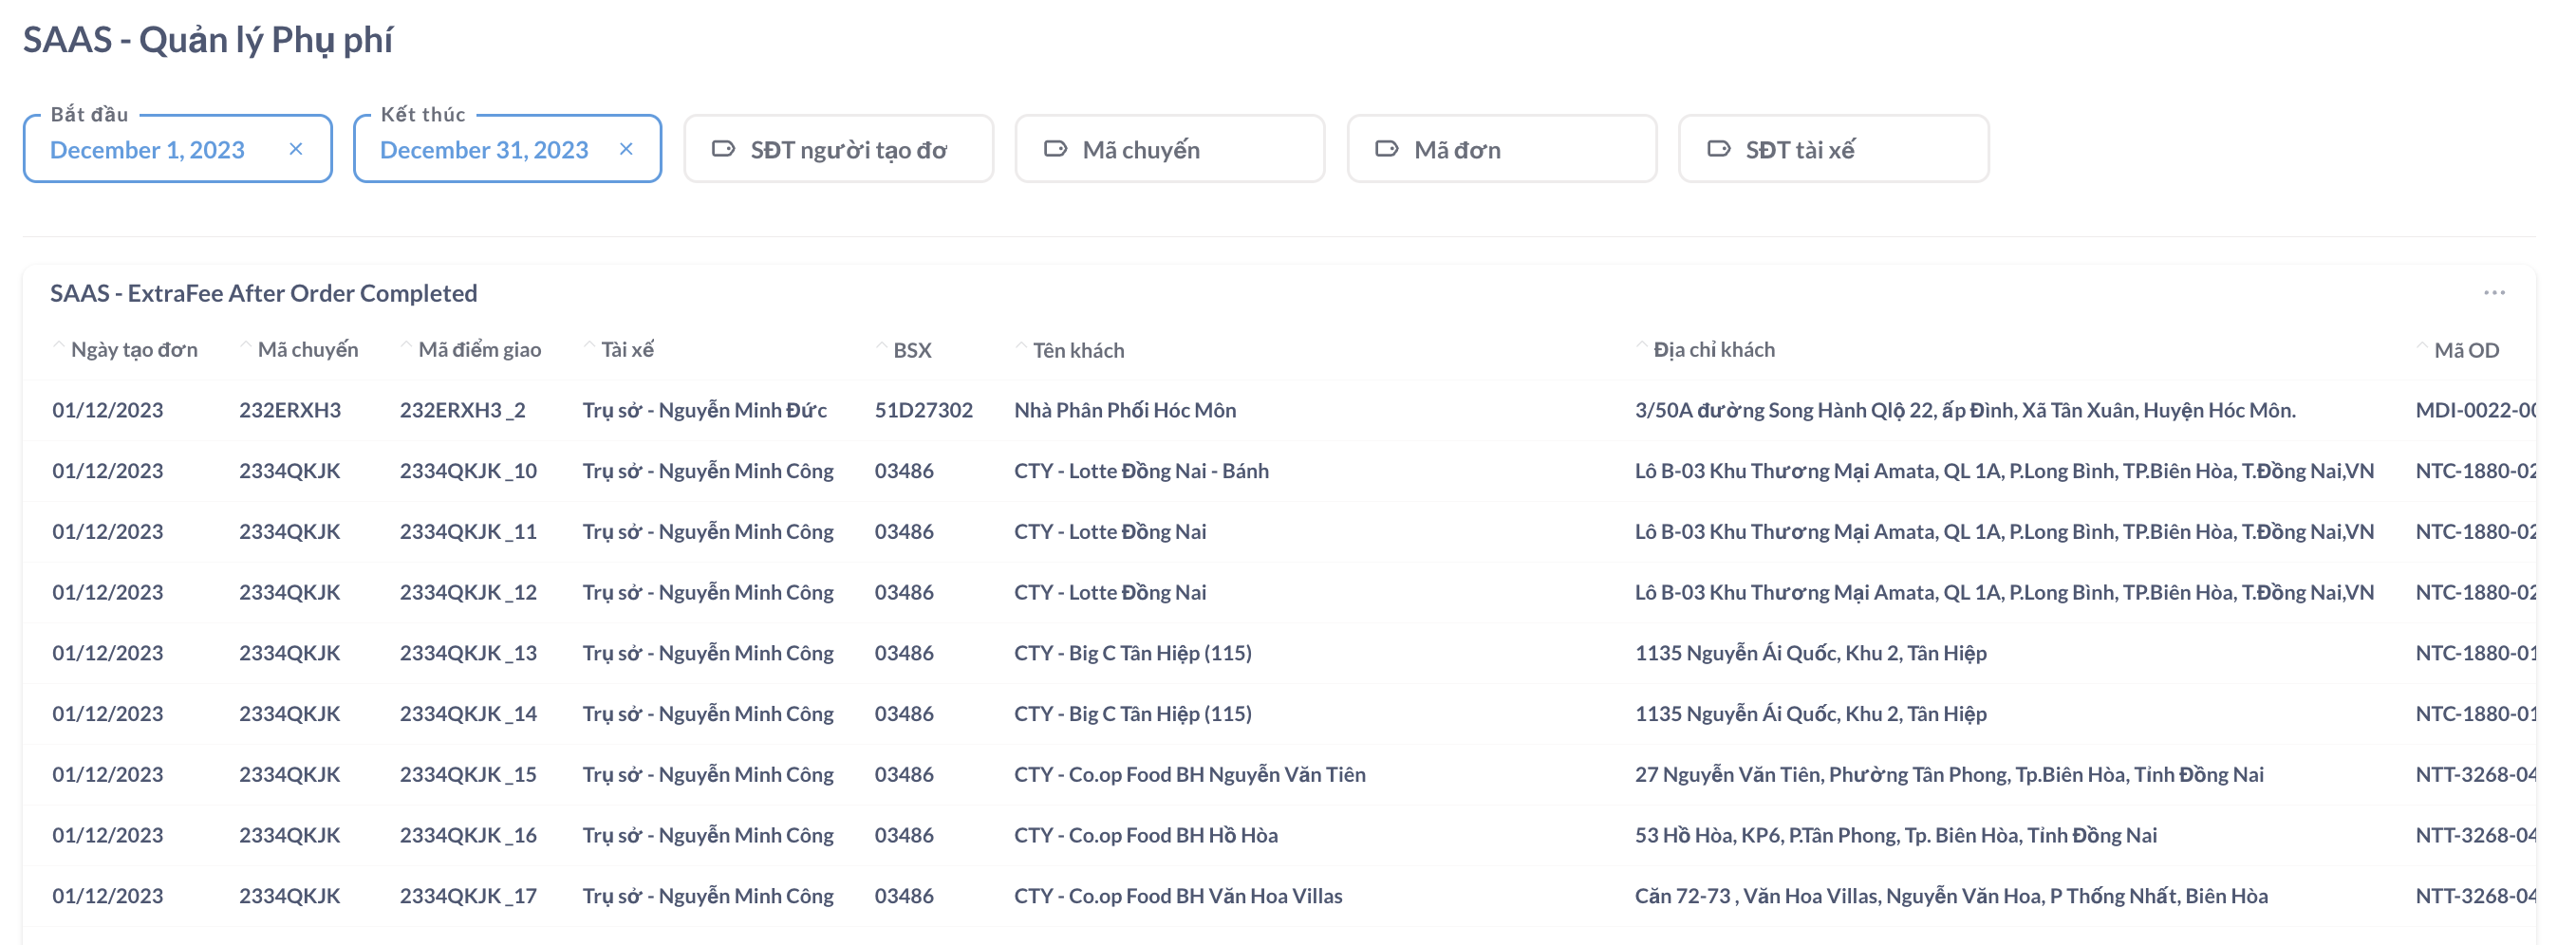
Extra Fee Management Report
Statistics report on additional fees for orders after completion
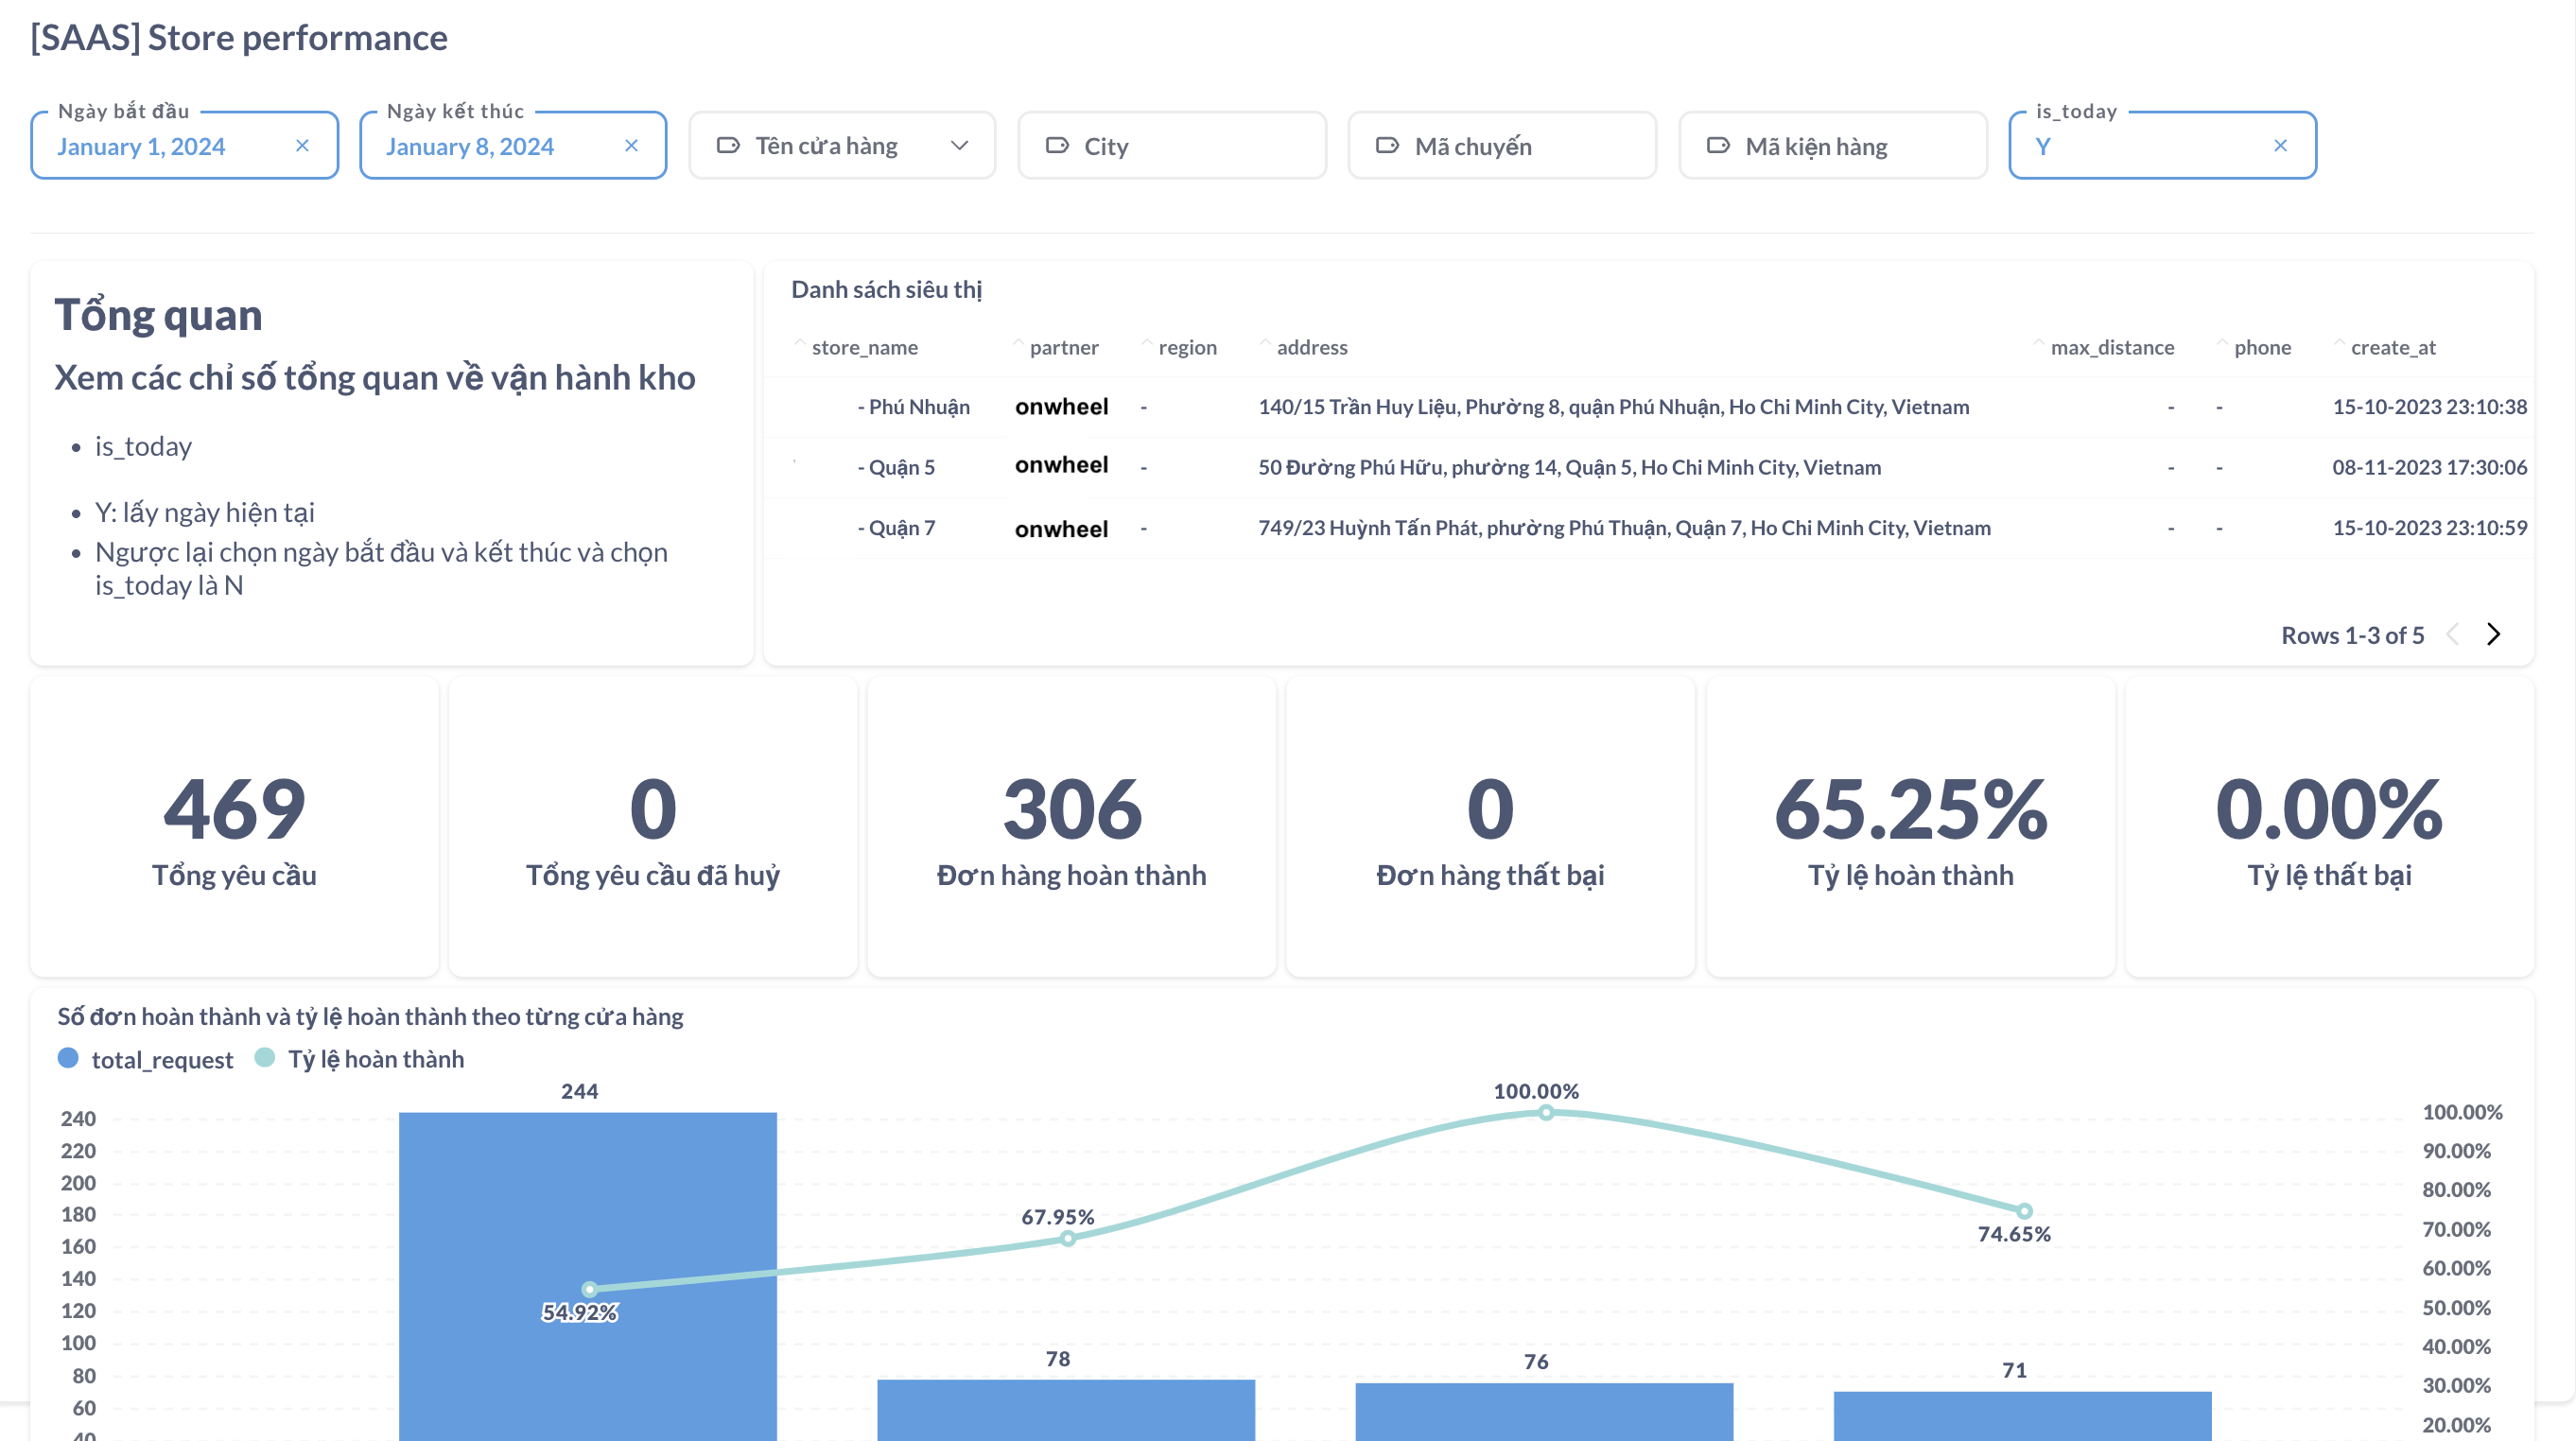
Store Productivity
This report helps customers monitor overall metrics about warehouse and store operations:
- List of warehouses/stores
- Statistics on the number of orders and the completion/failure rate of each warehouse/store
- Productivity of each warehouse/store
- Distribution of cancellation rates for each warehouse/store
- Statistics on the reasons for order cancellation
- Monitoring and evaluation of COD status
- Detailed report of orders for each warehouse/store
Zone Filter Reports
When customers use the Zone Management feature, their reports will be divided by Zone/Area.
If customers use the Zone Management feature, please contact the OnWheel team for support in configuring desired reports and tracking statistics by Zone/Area.