Overview
The Báo cáo vận hành (Operations report) page has 2 main tabs: Chỉ số chính (Key metrics) and Hiệu suất hoạt động (Operational performance).
Some businesses have an extra Báo cáo chi tiết (Detailed reports) tab with custom-configured reports. Contact your Ahamove point of contact if you need it.
Every figure is compared with the immediately preceding period of the same length. For example, if you select the last 30 days, it is compared with the 30 days before that. If the previous period has no data, the word mới (new) is shown.
Filters
Two filters sit in the right corner and apply to every tab:
| Filter | Used to |
|---|---|
| Khoảng thời gian (Date range) | Choose the period to view. The default is the last 30 days |
| Nhân viên (Staff) | View the figures of a single orderer only |
Want to see a single branch only? Change the Đang quản lý (Managing) box at the top of the left menu. See Managing.
"Chỉ số chính" (Key metrics) tab
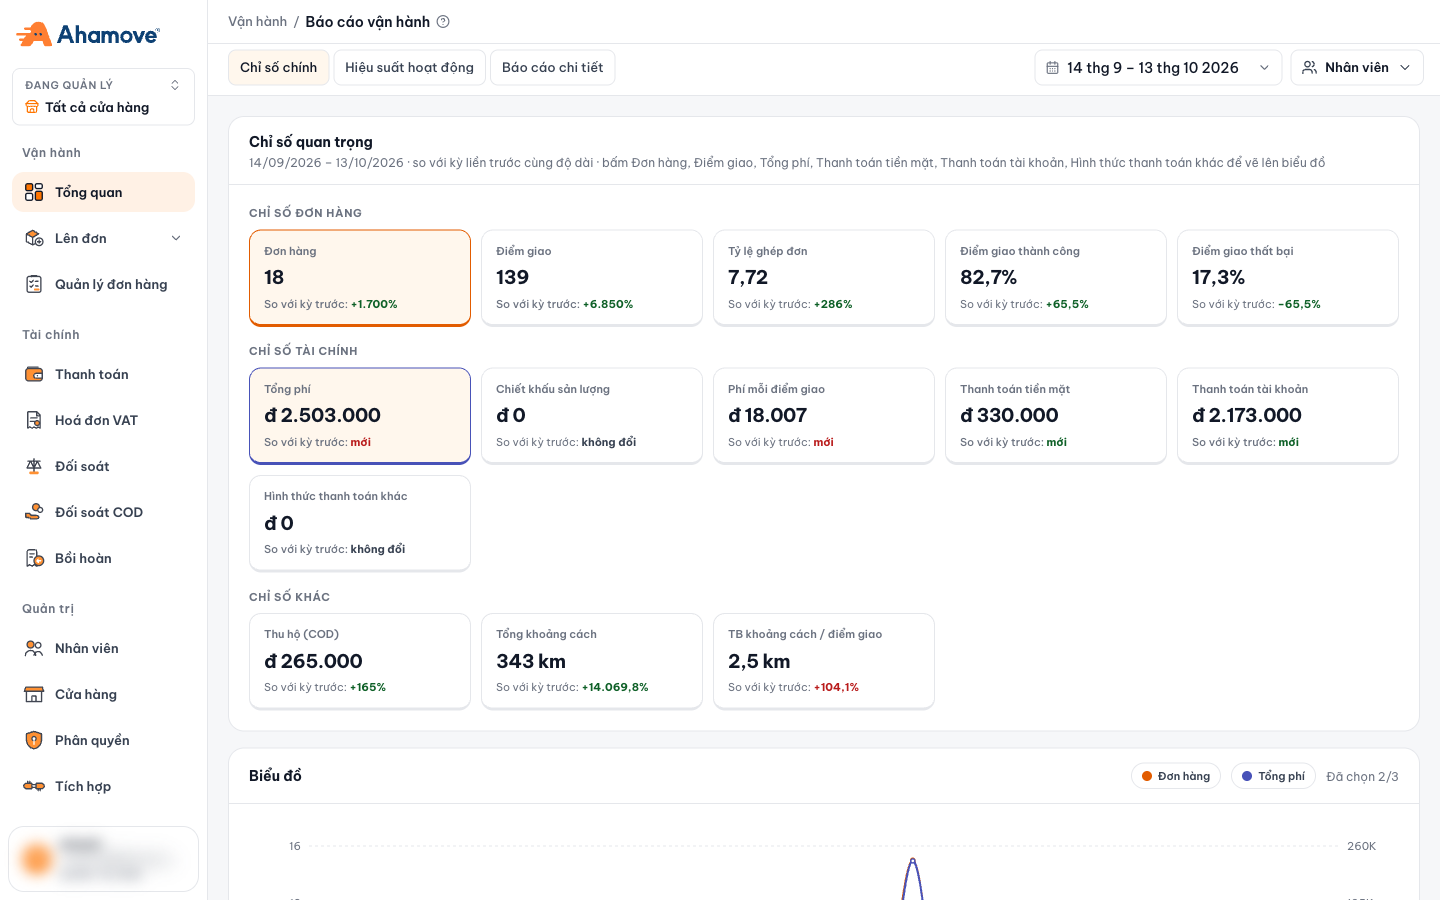
- Tabs of the Tổng quan (Overview) page
- Choose the date range
- Filter by staff
- Cards with a colored border are plotted on the chart. Click other cards to add them, up to 3
- Daily chart of the selected metrics
| Group | Metrics included |
|---|---|
| Chỉ số đơn hàng (Order metrics) | Đơn hàng (Orders) · Điểm giao (Drop-off points) · Tỷ lệ ghép đơn (Order batching rate) · Điểm giao thành công (%) (Successful drop-offs) · Điểm giao thất bại (%) (Failed drop-offs) |
| Chỉ số tài chính (Financial metrics) | Tổng phí (Total fees) · Chiết khấu sản lượng (Volume discount) · Phí mỗi điểm giao (Fee per drop-off) · Thanh toán tiền mặt (Cash payment) · Thanh toán tài khoản (Account payment) · Hình thức thanh toán khác (Other payment methods) |
| Chỉ số khác (Other metrics) | Thu hộ (COD) (Cash on delivery) · Tổng khoảng cách (Total distance) · TB khoảng cách / điểm giao (Avg. distance per drop-off) |
Click the Đơn hàng, Điểm giao, Tổng phí (Orders, Drop-off points, Total fees) cards or the payment cards to plot them on the chart (up to 3 metrics at once). For example, select Đơn hàng (Orders) + Tổng phí (Total fees) to see whether fees rise with the number of orders.
"Hiệu suất hoạt động" (Operational performance) tab
Use this tab to assess delivery quality and speed.
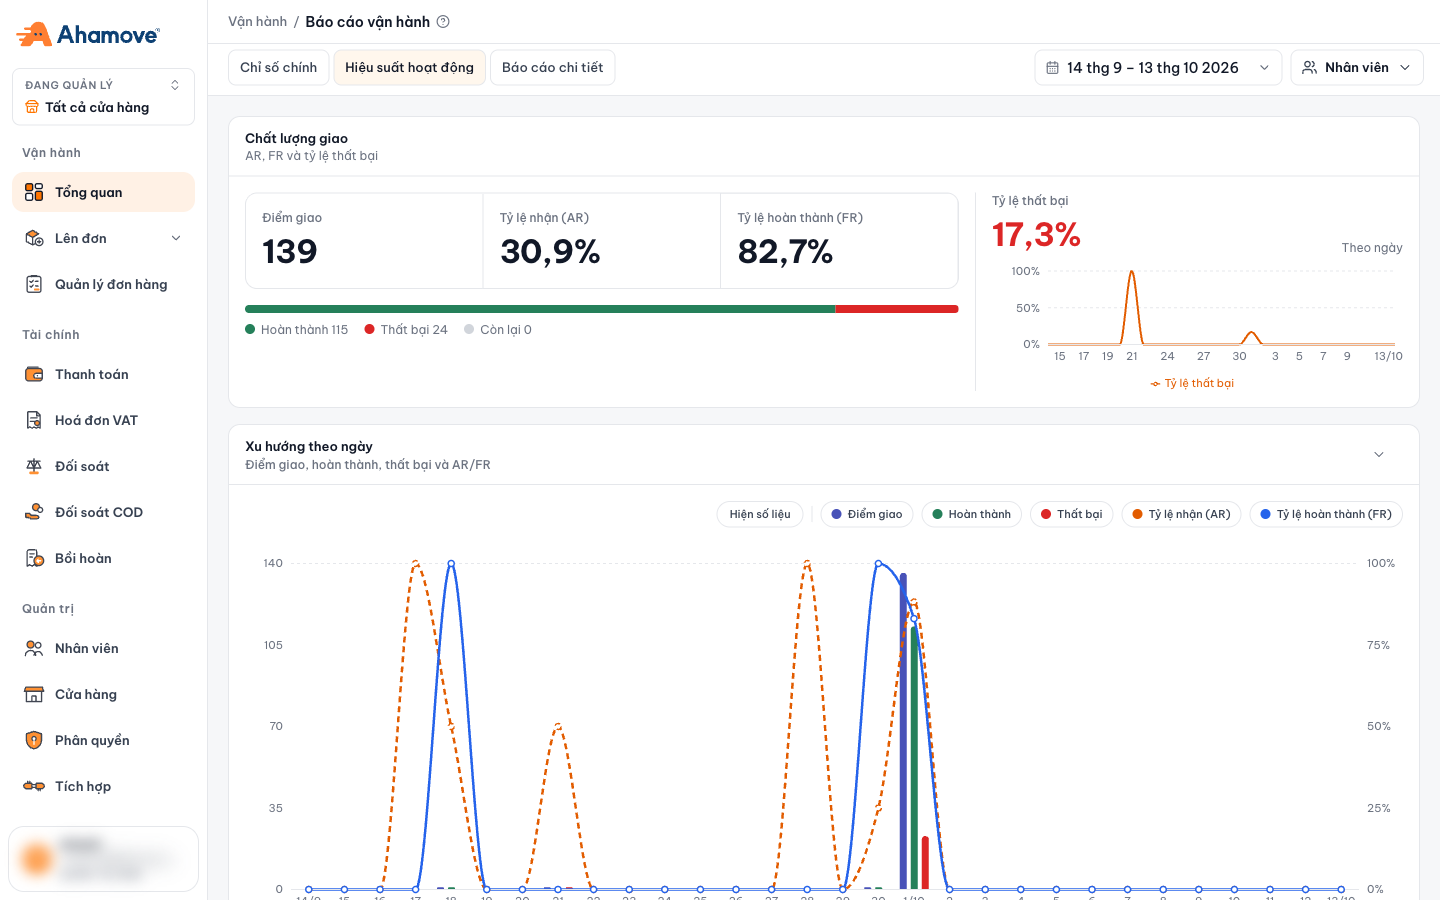
| Section | Includes | How to read it |
|---|---|---|
| Chất lượng giao (Delivery quality) | Điểm giao (Drop-off points) · AR (acceptance rate) · FR (fulfillment rate, with Hoàn thành (COMPLETED) / Thất bại (Failed) / Còn lại (Remaining) counts) · Daily failure rate | Low AR → orders struggle to find a driver. Compare FR with AR to see orders dropped after being accepted |
| Xu hướng theo ngày (Daily trends) | Drop-off points, Completed, Failed, AR, and FR on the same chart. Click Hiện số liệu (Show data) to see the table | A day with an unusual spike in failures → check that day's orders |
| Thời gian vận hành (Operating times) | ① Time to accept the order · ② Accepted → Delivered · ③ Full order (order created → delivered) | ① high → driver shortage; ② high → slow delivery |
| Chi phí giao hàng (Delivery costs) | Total fees broken down by day, shown as Biểu đồ (Chart) or Bảng (Table) |